Work & Study · Free printable
Free Printable T-Chart Graphic Organizer
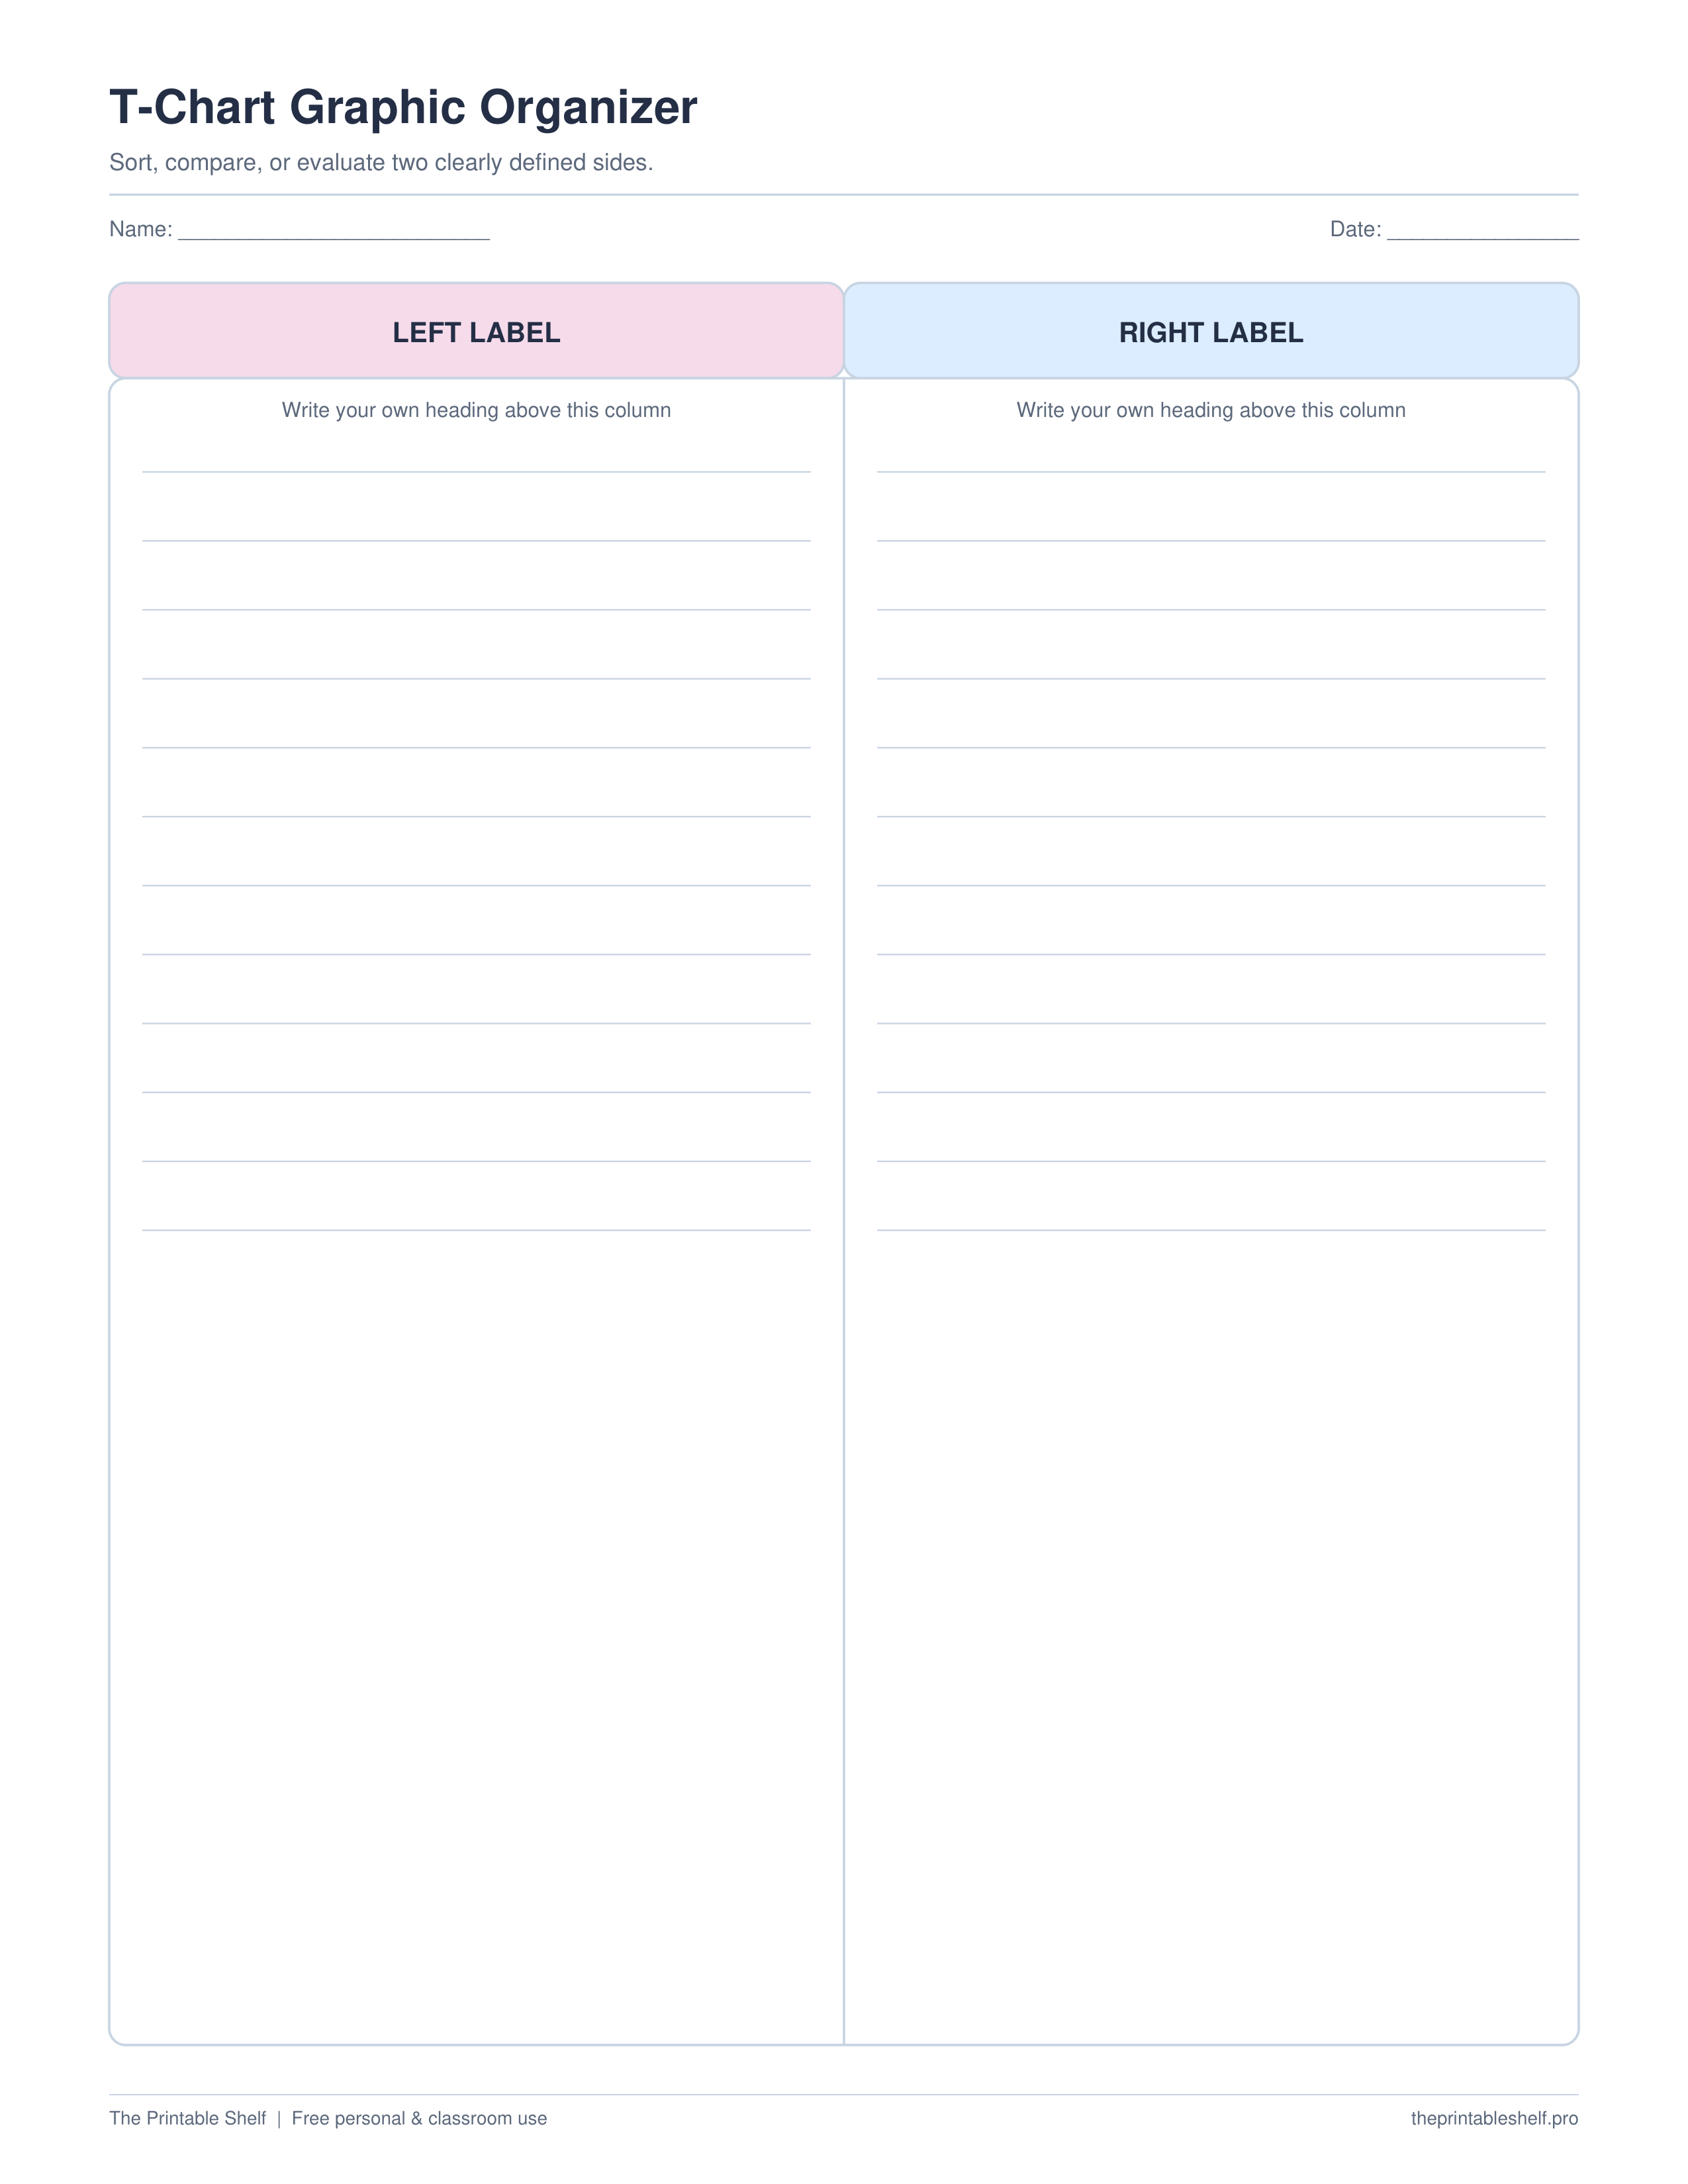
A T-chart is a flexible two-column organizer for sorting information into paired categories. Label the left and right sides for the task—such as pros and cons, fact and opinion, claim and evidence, or two topics—then place each note where it belongs. This printable keeps the columns roomy enough for short explanations, not just single words.
Edited by Tessa Vaughn · Planning & Organization Editor
Free download
Choose your file size
Print at 100% / Actual Size for the cleanest margins. Pick the paper size your printer normally uses.
No sign-up required · personal/classroom use
More useful layouts
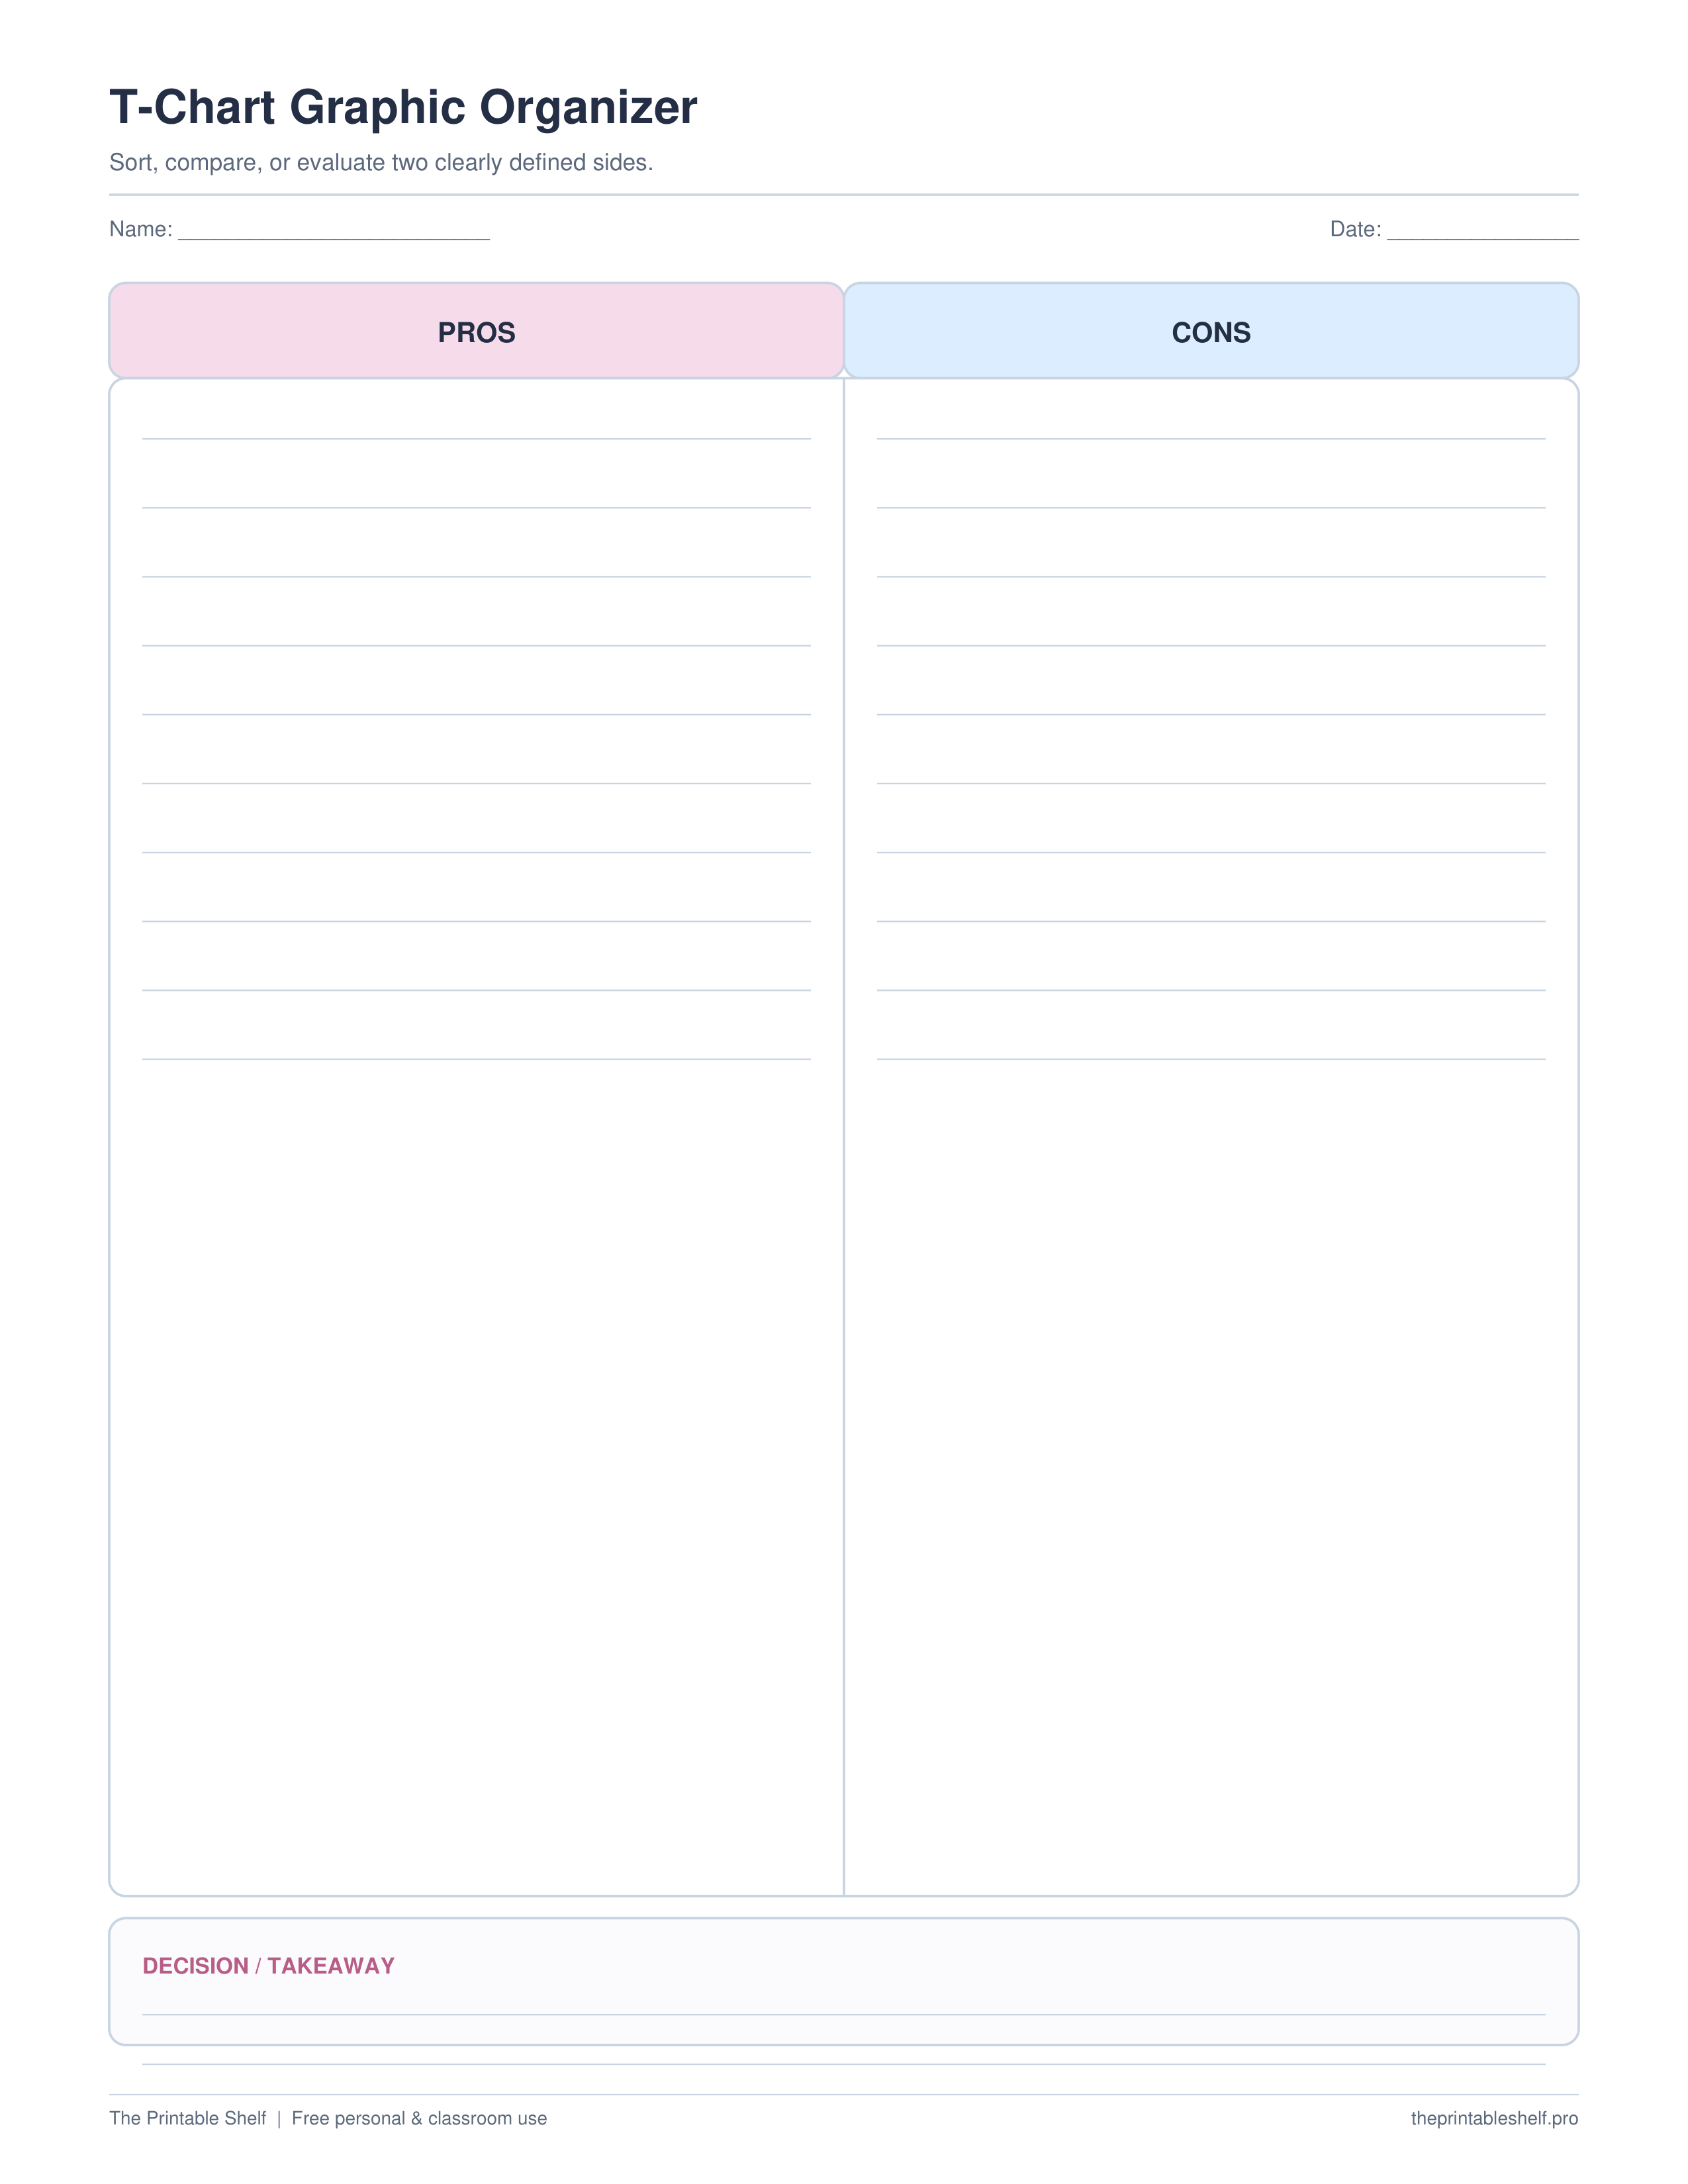
Lined comparison
Matching writing lines make two-topic comparisons easier to scan.
What this printable is for
A clean two-column thinking sheet that can be relabeled for dozens of school, study, and planning tasks. Unlike a compare-and-contrast organizer with fixed prompts, a T-chart stays intentionally open: the user decides what the two sides mean, which makes it useful for classification, decision-making, text evidence, observation, and quick note sorting.
How to use it
Start by writing one clear label above each column before adding any notes. The labels should describe a real contrast or sorting rule, not two vague topics. ‘Advantages / Disadvantages,’ ‘Claim / Evidence,’ and ‘Plant cells / Animal cells’ tell you exactly where a note belongs. If the labels overlap too much, pause and rewrite them; a T-chart only works when the two sides make the sorting decision easier.
Add one idea per line or short block. Keep entries brief enough that you can scan the two sides quickly, but do not reduce everything to isolated keywords when an explanation is needed. For a reading assignment, for example, ‘The narrator says the town was empty’ is stronger evidence than simply writing ‘empty town.’ If an item could fit both columns, mark it with a small star and discuss why instead of forcing it onto one side.
Use the chart to compare the balance between the columns after you have several entries. A pros-and-cons chart with seven meaningful cons and one weak pro is telling you something different from a chart with equal evidence on both sides. In a text-evidence task, a nearly empty evidence column can reveal that a claim needs more support. The value comes from looking across the divider, not merely filling the page from top to bottom.
For two-topic comparison, keep the same type of information at roughly the same height when possible. If the left column lists habitat, diet, and lifespan for one animal, record habitat, diet, and lifespan for the other animal on corresponding lines. That makes differences easier to see. If the assignment needs similarities as a separate category, switch to the compare-and-contrast grid or Venn diagram instead of squeezing a third kind of information into this two-column format.
For decision-making, label the columns before researching so you do not unconsciously change the criteria after seeing the results. Write concrete observations rather than emotional duplicates: ‘costs $18 more per month’ is more useful than ‘expensive.’ After the chart is complete, circle the entries that matter most to the decision and use those as the basis for a conclusion, discussion answer, or paragraph.
For younger learners, give the column labels in advance and model representative examples before independent work. Older students can create their own labels and then explain the rule they used to sort borderline items. If you reuse the format often, print several blank copies and write the labels by hand; the same page can serve science, reading, social studies, vocabulary, and planning without becoming a new worksheet every time.
Customize instead
Need a different title, paper size, or orientation? →
Use the free Graphic Organizer Maker to build a custom Venn, KWL, Frayer, story map, T-chart, main-idea, sequence, or cause-and-effect page.
Also in a free pack
Download this organizer together with related pages when you want one reusable master PDF instead of separate files.
Best uses for this template
Ways to use it
Reading & evidence
Label one side Claim and the other Evidence, then keep each interpretation next to the detail that supports it before drafting a response.
Science & social studies
Compare two systems, groups, eras, or organisms using matching categories so the differences stay easy to scan.
Decision planning
Use Pros / Cons or Option A / Option B, record concrete differences, then circle the few factors that should actually drive the decision.
Common mistakes to avoid
Using headings that overlap
Rewrite the two labels so each new note has a clear sorting rule.
Writing unrelated details on each side
When comparing two topics, use matching categories or questions across both columns.
Treating every entry as equally important
After sorting, mark the strongest evidence or most important differences before drawing a conclusion.
Included layout options
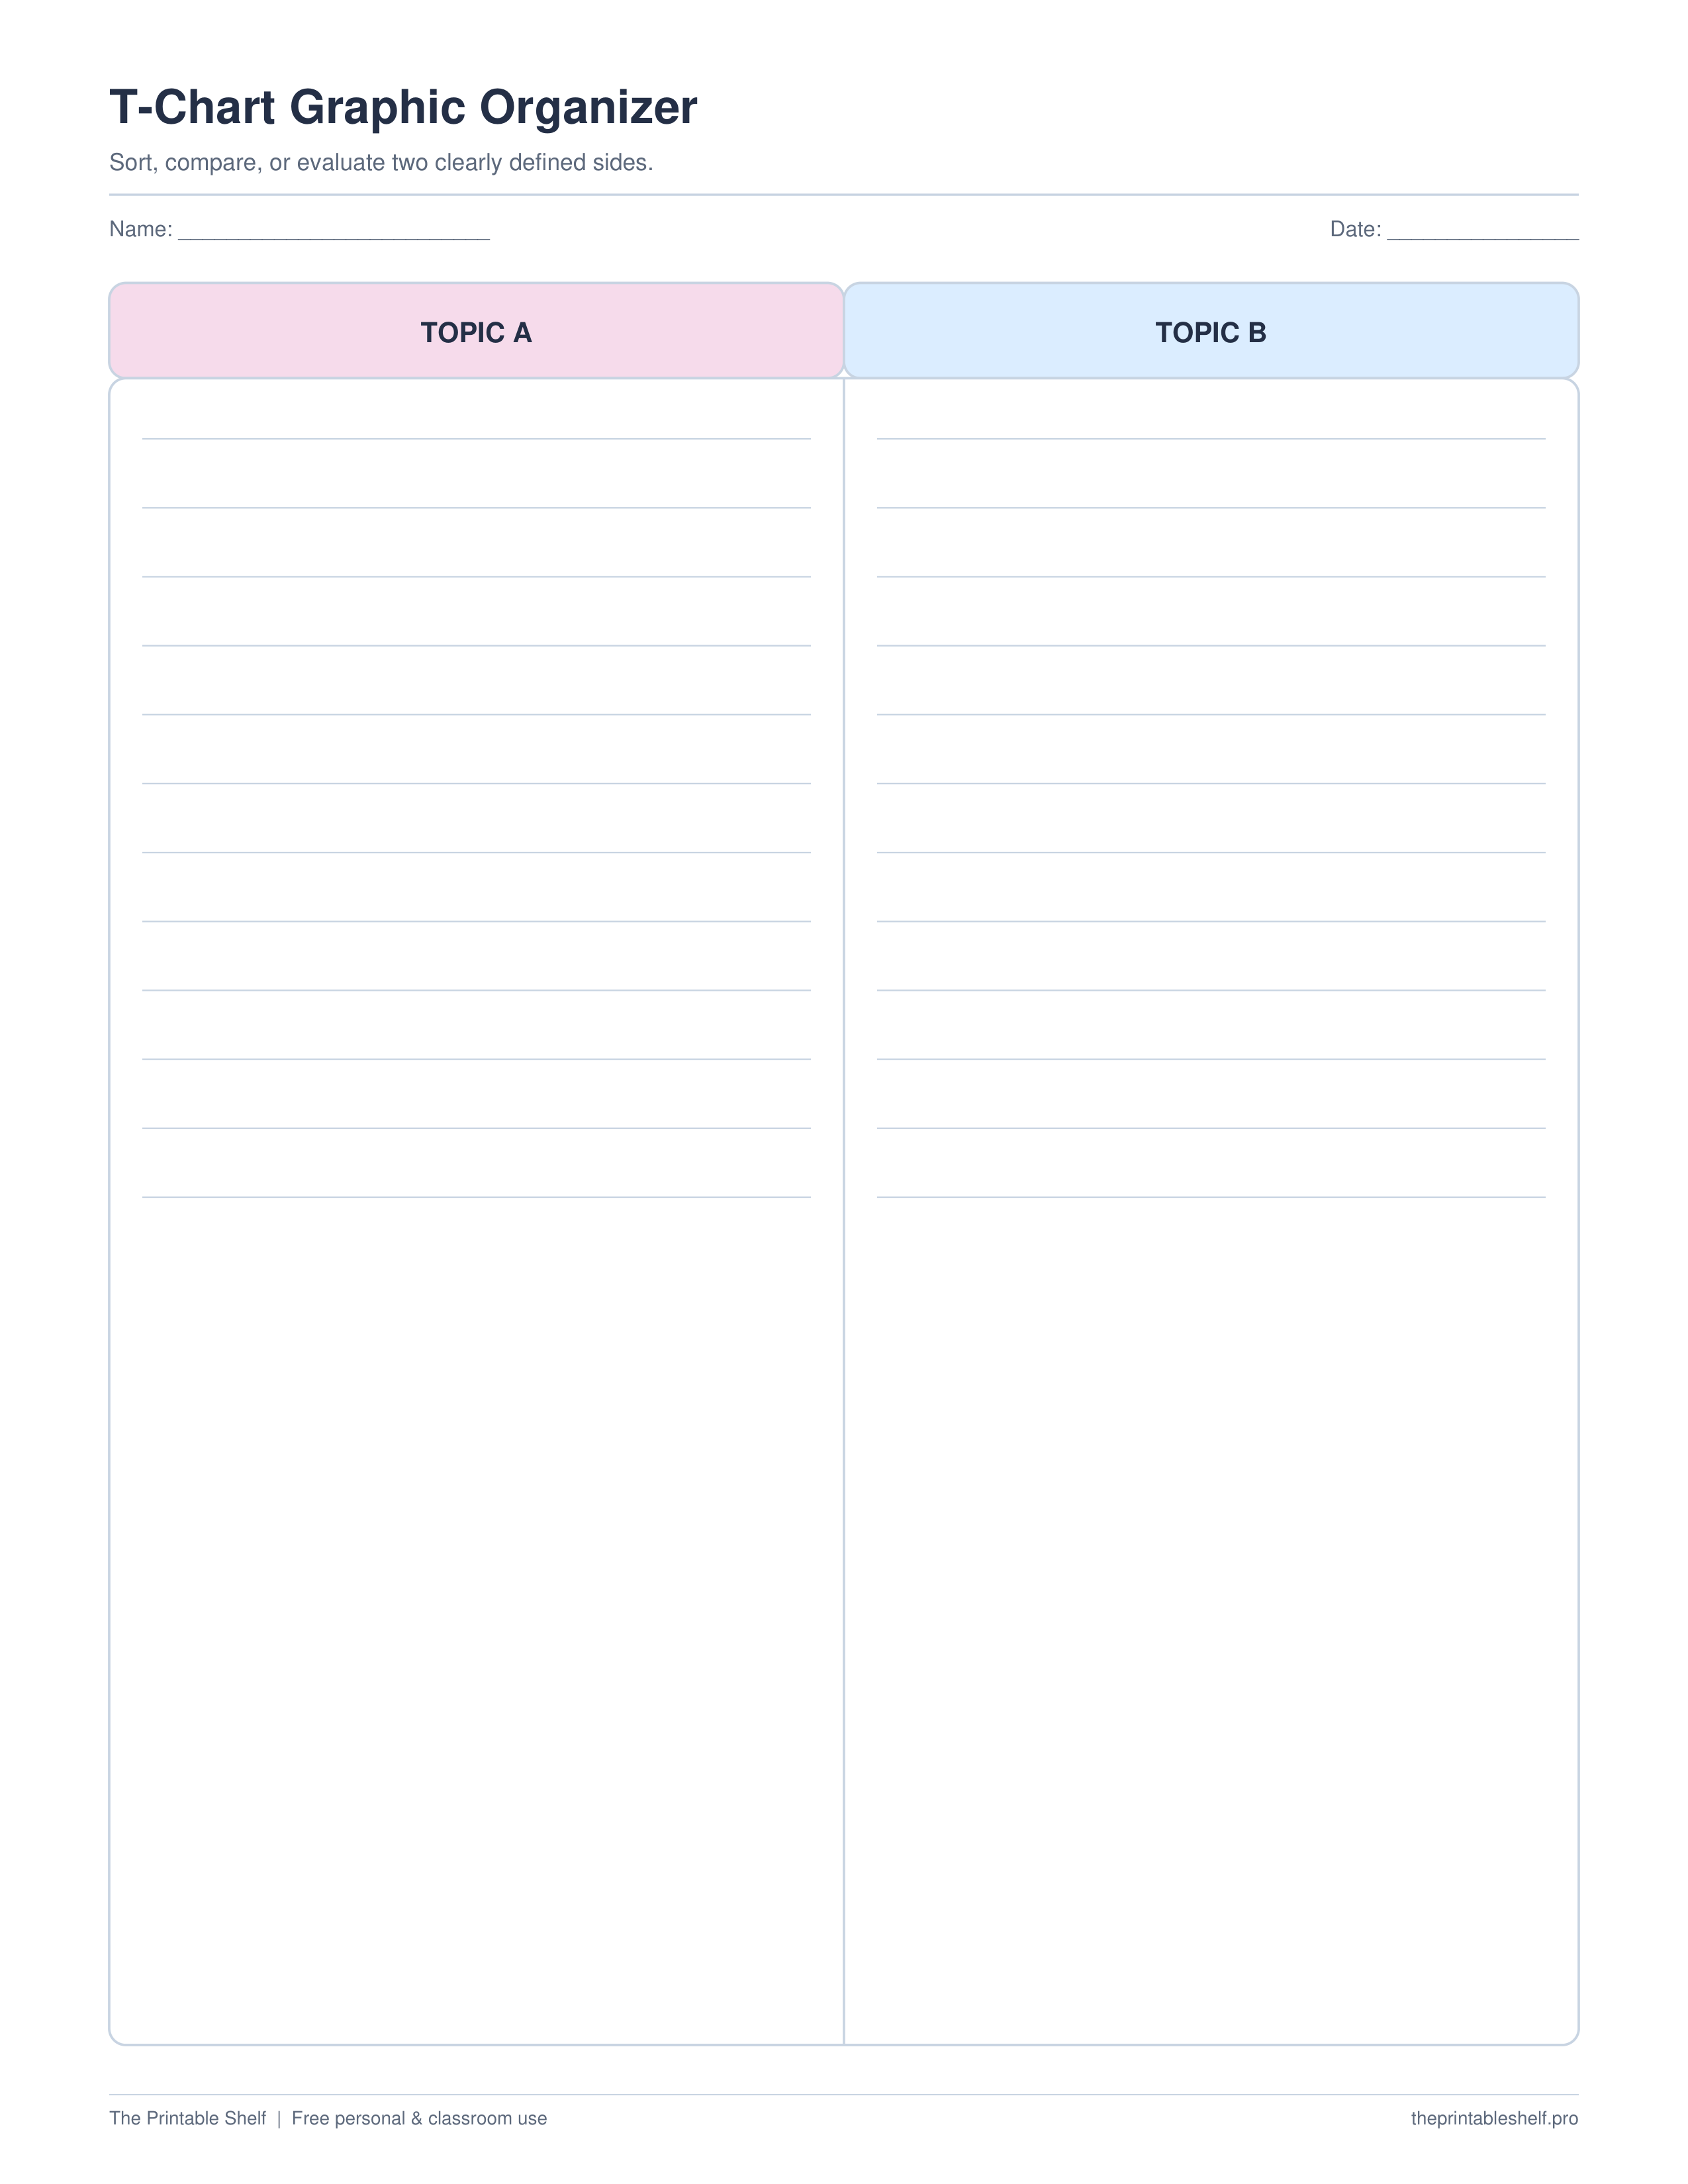
Blank labels
Reuse the same sheet for any two-category task
Layout: Two roomy columns with writable headings
Lined comparison
Support phrase and sentence-length entries
Layout: Matching light writing lines across both columns
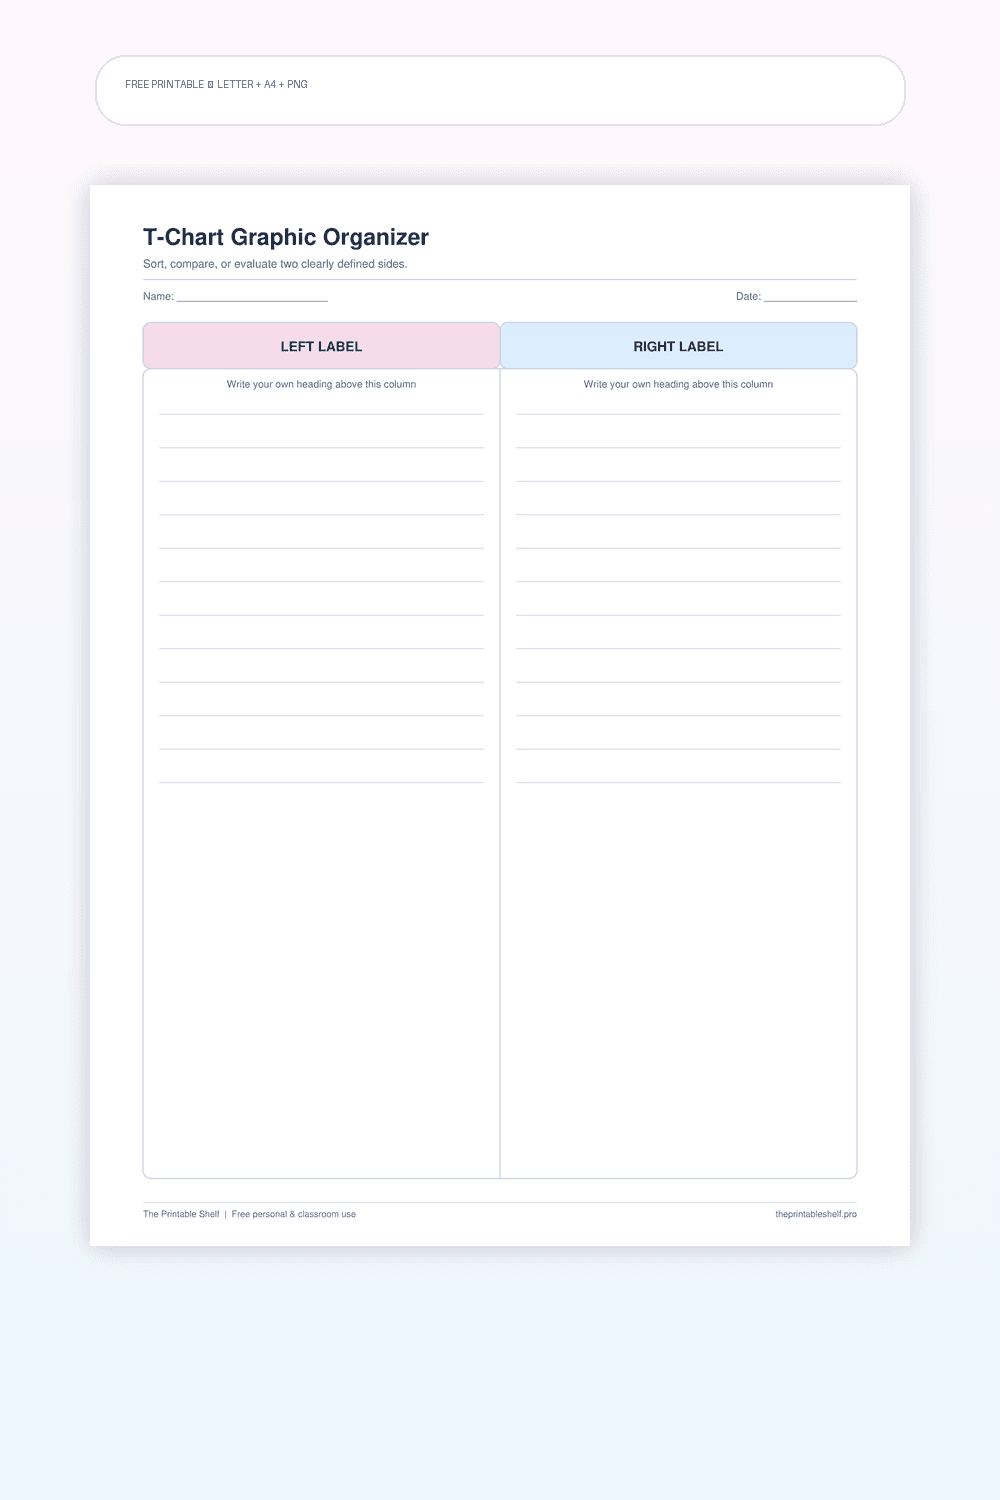
Pros / cons
Fast decision and evaluation tasks
Layout: Prelabeled sides plus small conclusion box
Classroom fit
Suggested grades, use modes & standards
Suggested grade bands
These are practical use ranges, not hard limits. Text complexity and the amount of teacher modeling matter more than the worksheet alone.
Good fit for
Scaffold level: Beginner.
Common Core crosswalk
No narrow standards code is listed for this general-purpose template. Use it where the thinking task fits your local curriculum.
Frequently asked questions
What is a T-chart graphic organizer used for?
Use a T-chart to sort information into two categories, compare two topics, list pros and cons, separate claims from evidence, or organize any task with two clearly defined sides.
What is the difference between a T-chart and a Venn diagram?
A T-chart keeps two categories separate. A Venn diagram is better when you also need a visible area for characteristics shared by both topics.
Can students change the column headings?
Yes. The usefulness of a T-chart comes from choosing headings that match the exact task, so the two labels should be customized whenever needed.
Helpful guides
See where this organizer fits, when a different layout works better, and how to turn the completed page into a useful next step.
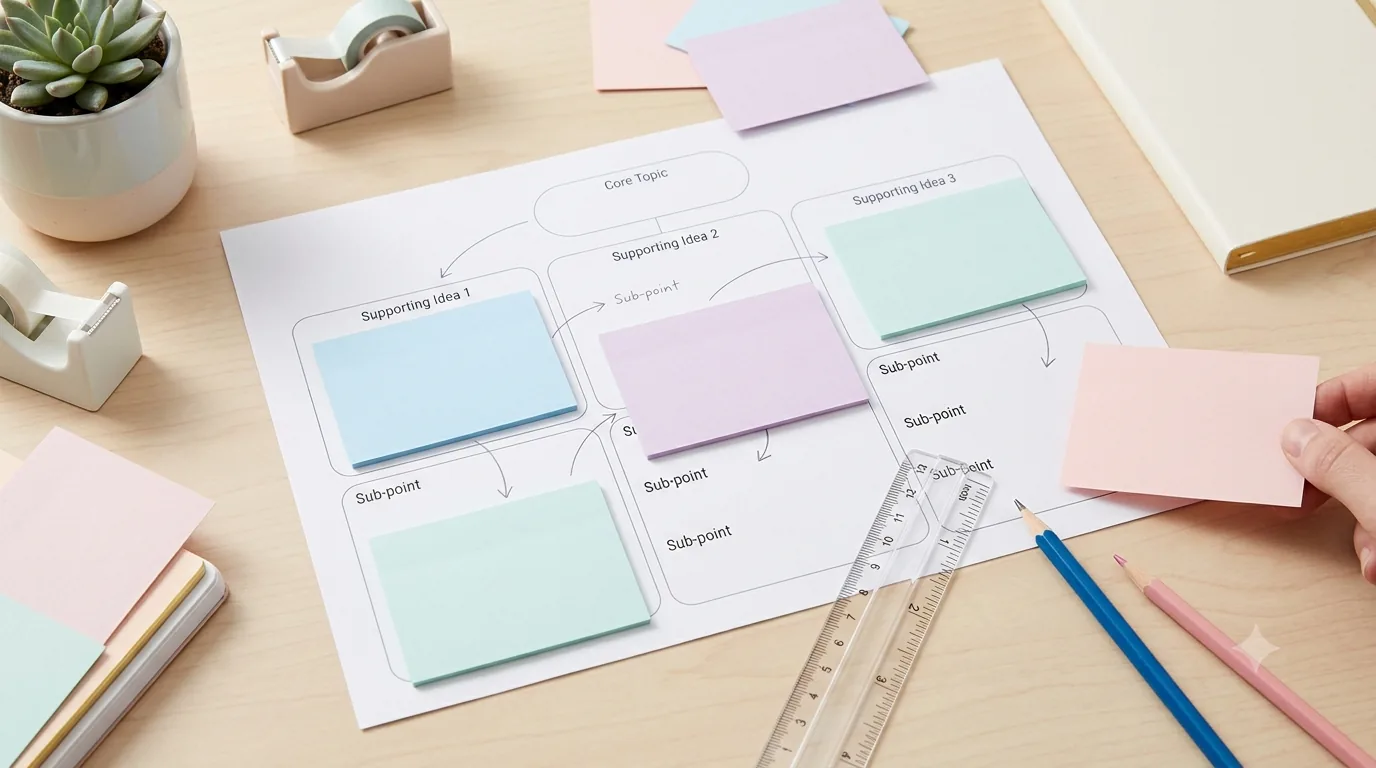
How to Use Graphic Organizers Effectively (Without Turning Them Into Busywork)
Learn how to choose, model, scaffold, and reuse graphic organizers so students think with them instead of simply filling in boxes.
Read guide →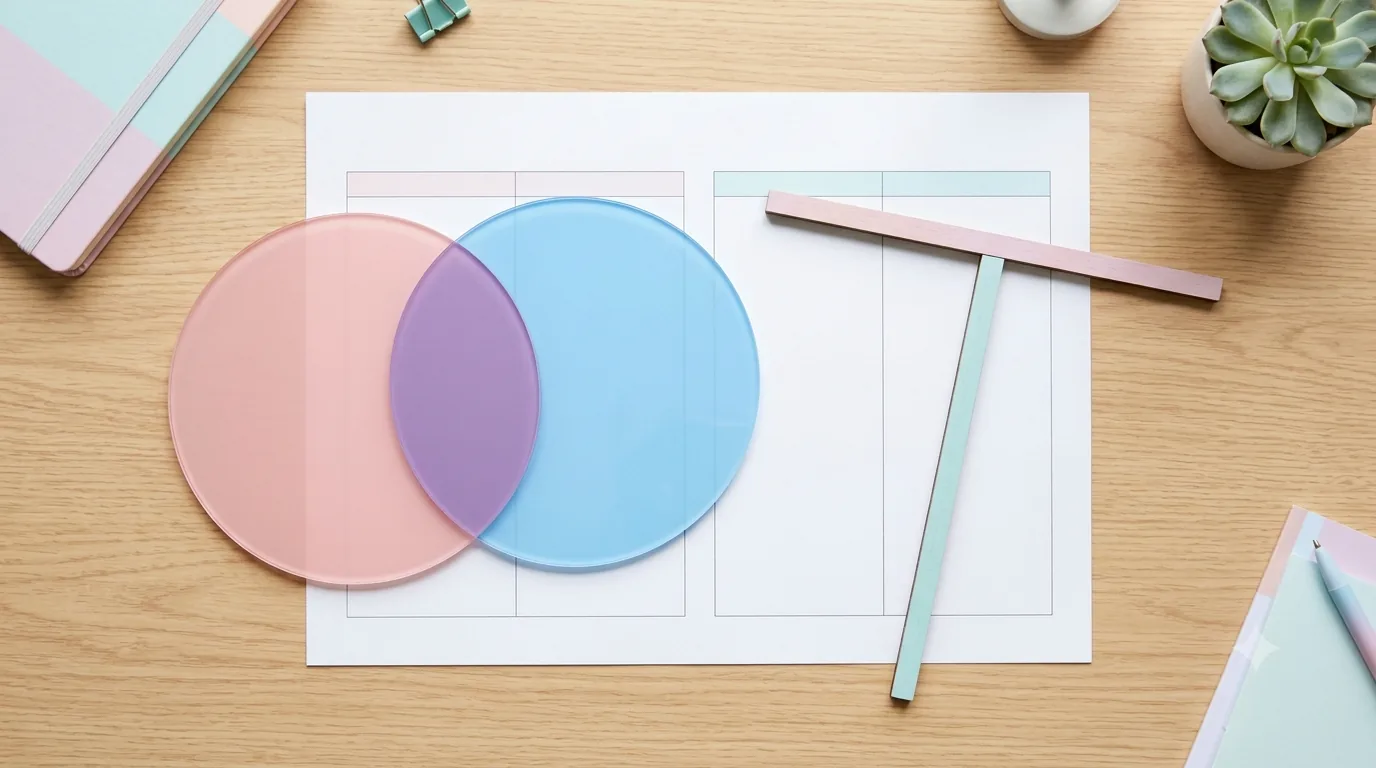
Venn Diagram vs. T-Chart: Which One Should You Use?
Compare Venn diagrams and T-charts, see when each organizer works best, and use a simple decision rule for reading, writing, and classroom tasks.
Read guide →Keep organizing
You might also like
Free printable
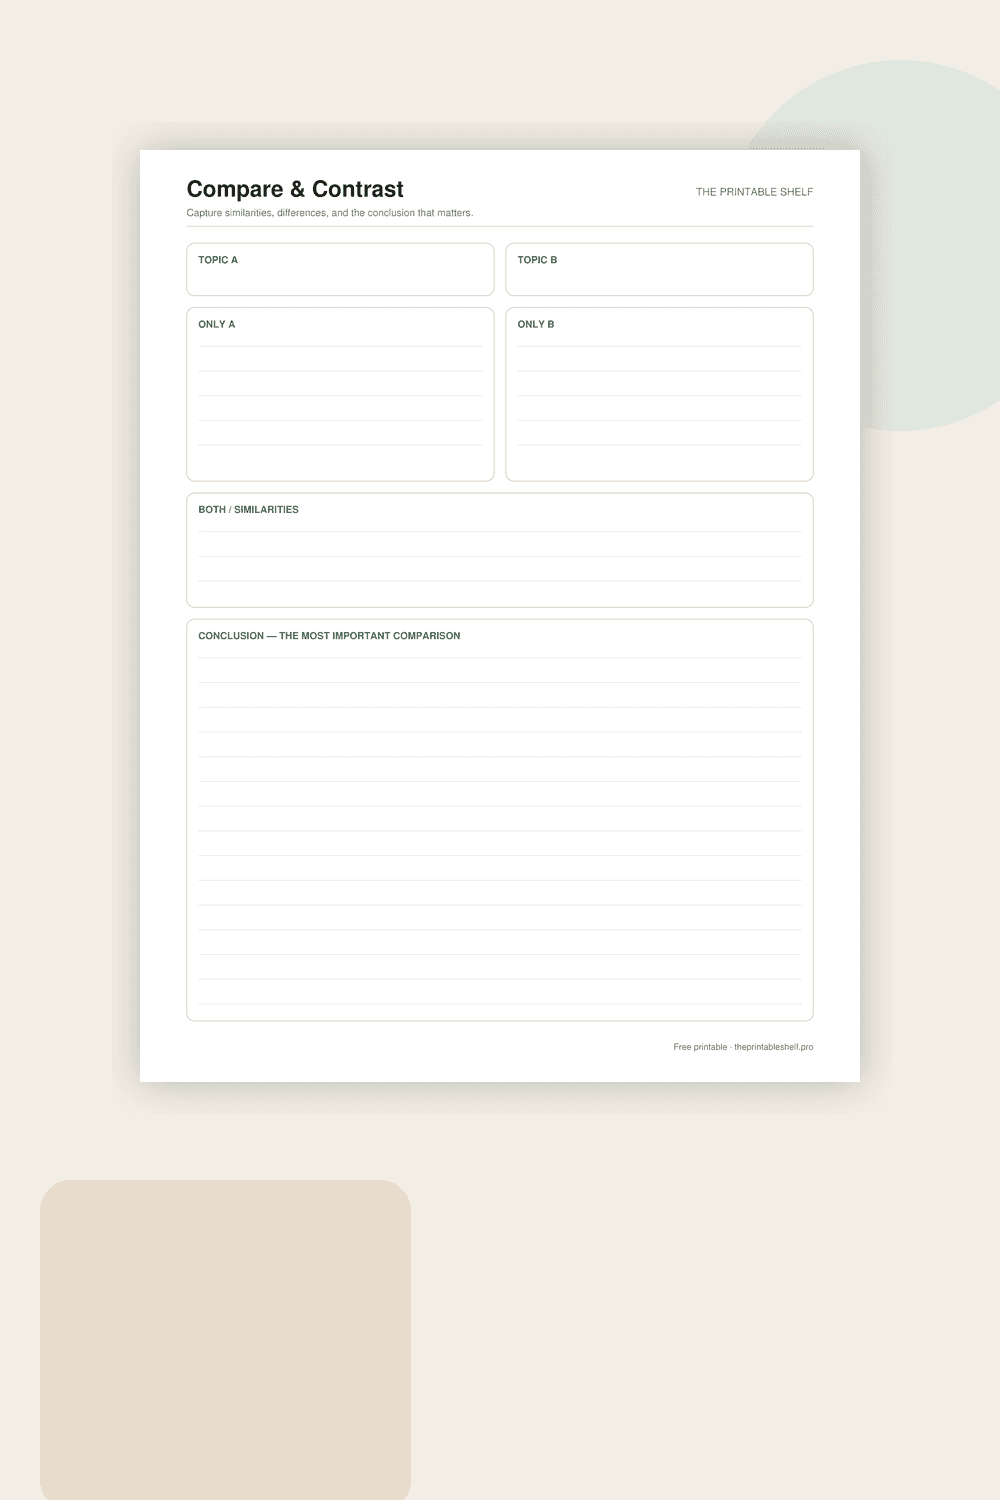
Compare and Contrast Graphic Organizer
A structured alternative to a Venn diagram for learners who need more writing space. Two difference boxes sit side by side, a full-width similarities area keeps shared traits together, and the final conclusion section turns the collected notes into an actual comparison rather than stopping at a list.
Free printable
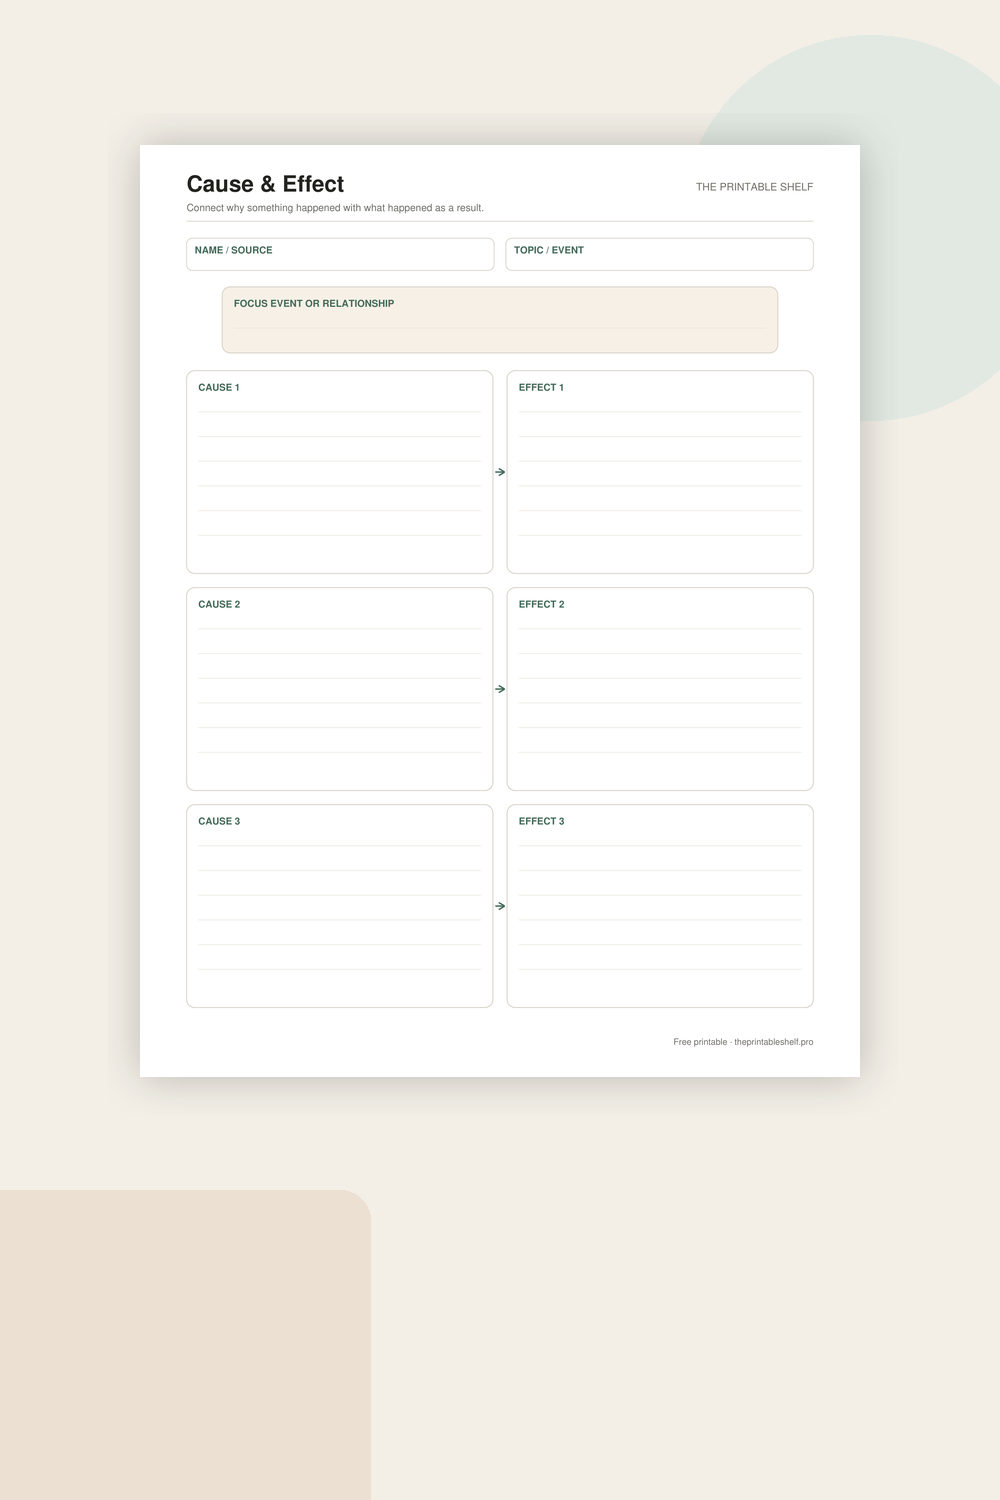
Cause and Effect Graphic Organizer
A one-page organizer for examining causal relationships instead of simply listing events. Each cause is visually connected to its effect, and the focus box at the top gives the page one clear subject so students can analyze several relationships without losing track of the larger event, text, or concept.
Free printable
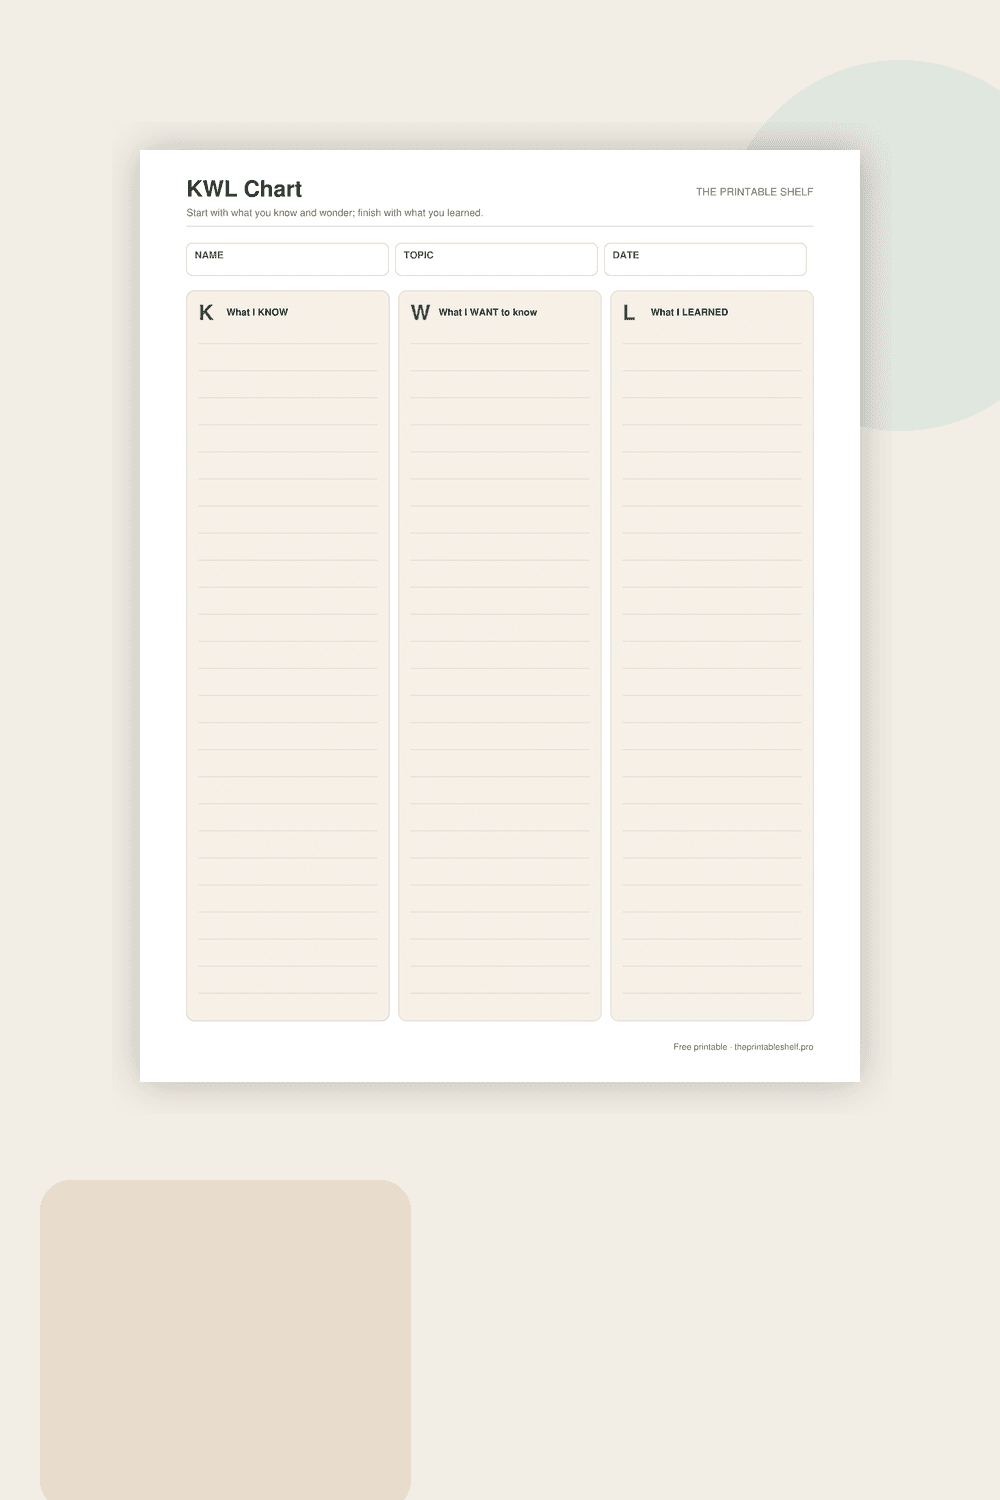
Printable KWL Chart
A three-column learning organizer for activating prior knowledge and making questions visible before a lesson begins. The K column records what the learner thinks they know, W captures questions or wonderings, and L is completed afterward with new information, corrections, and answers discovered during learning.