Work & Study · Free printable
Free Printable 3-Circle Venn Diagram
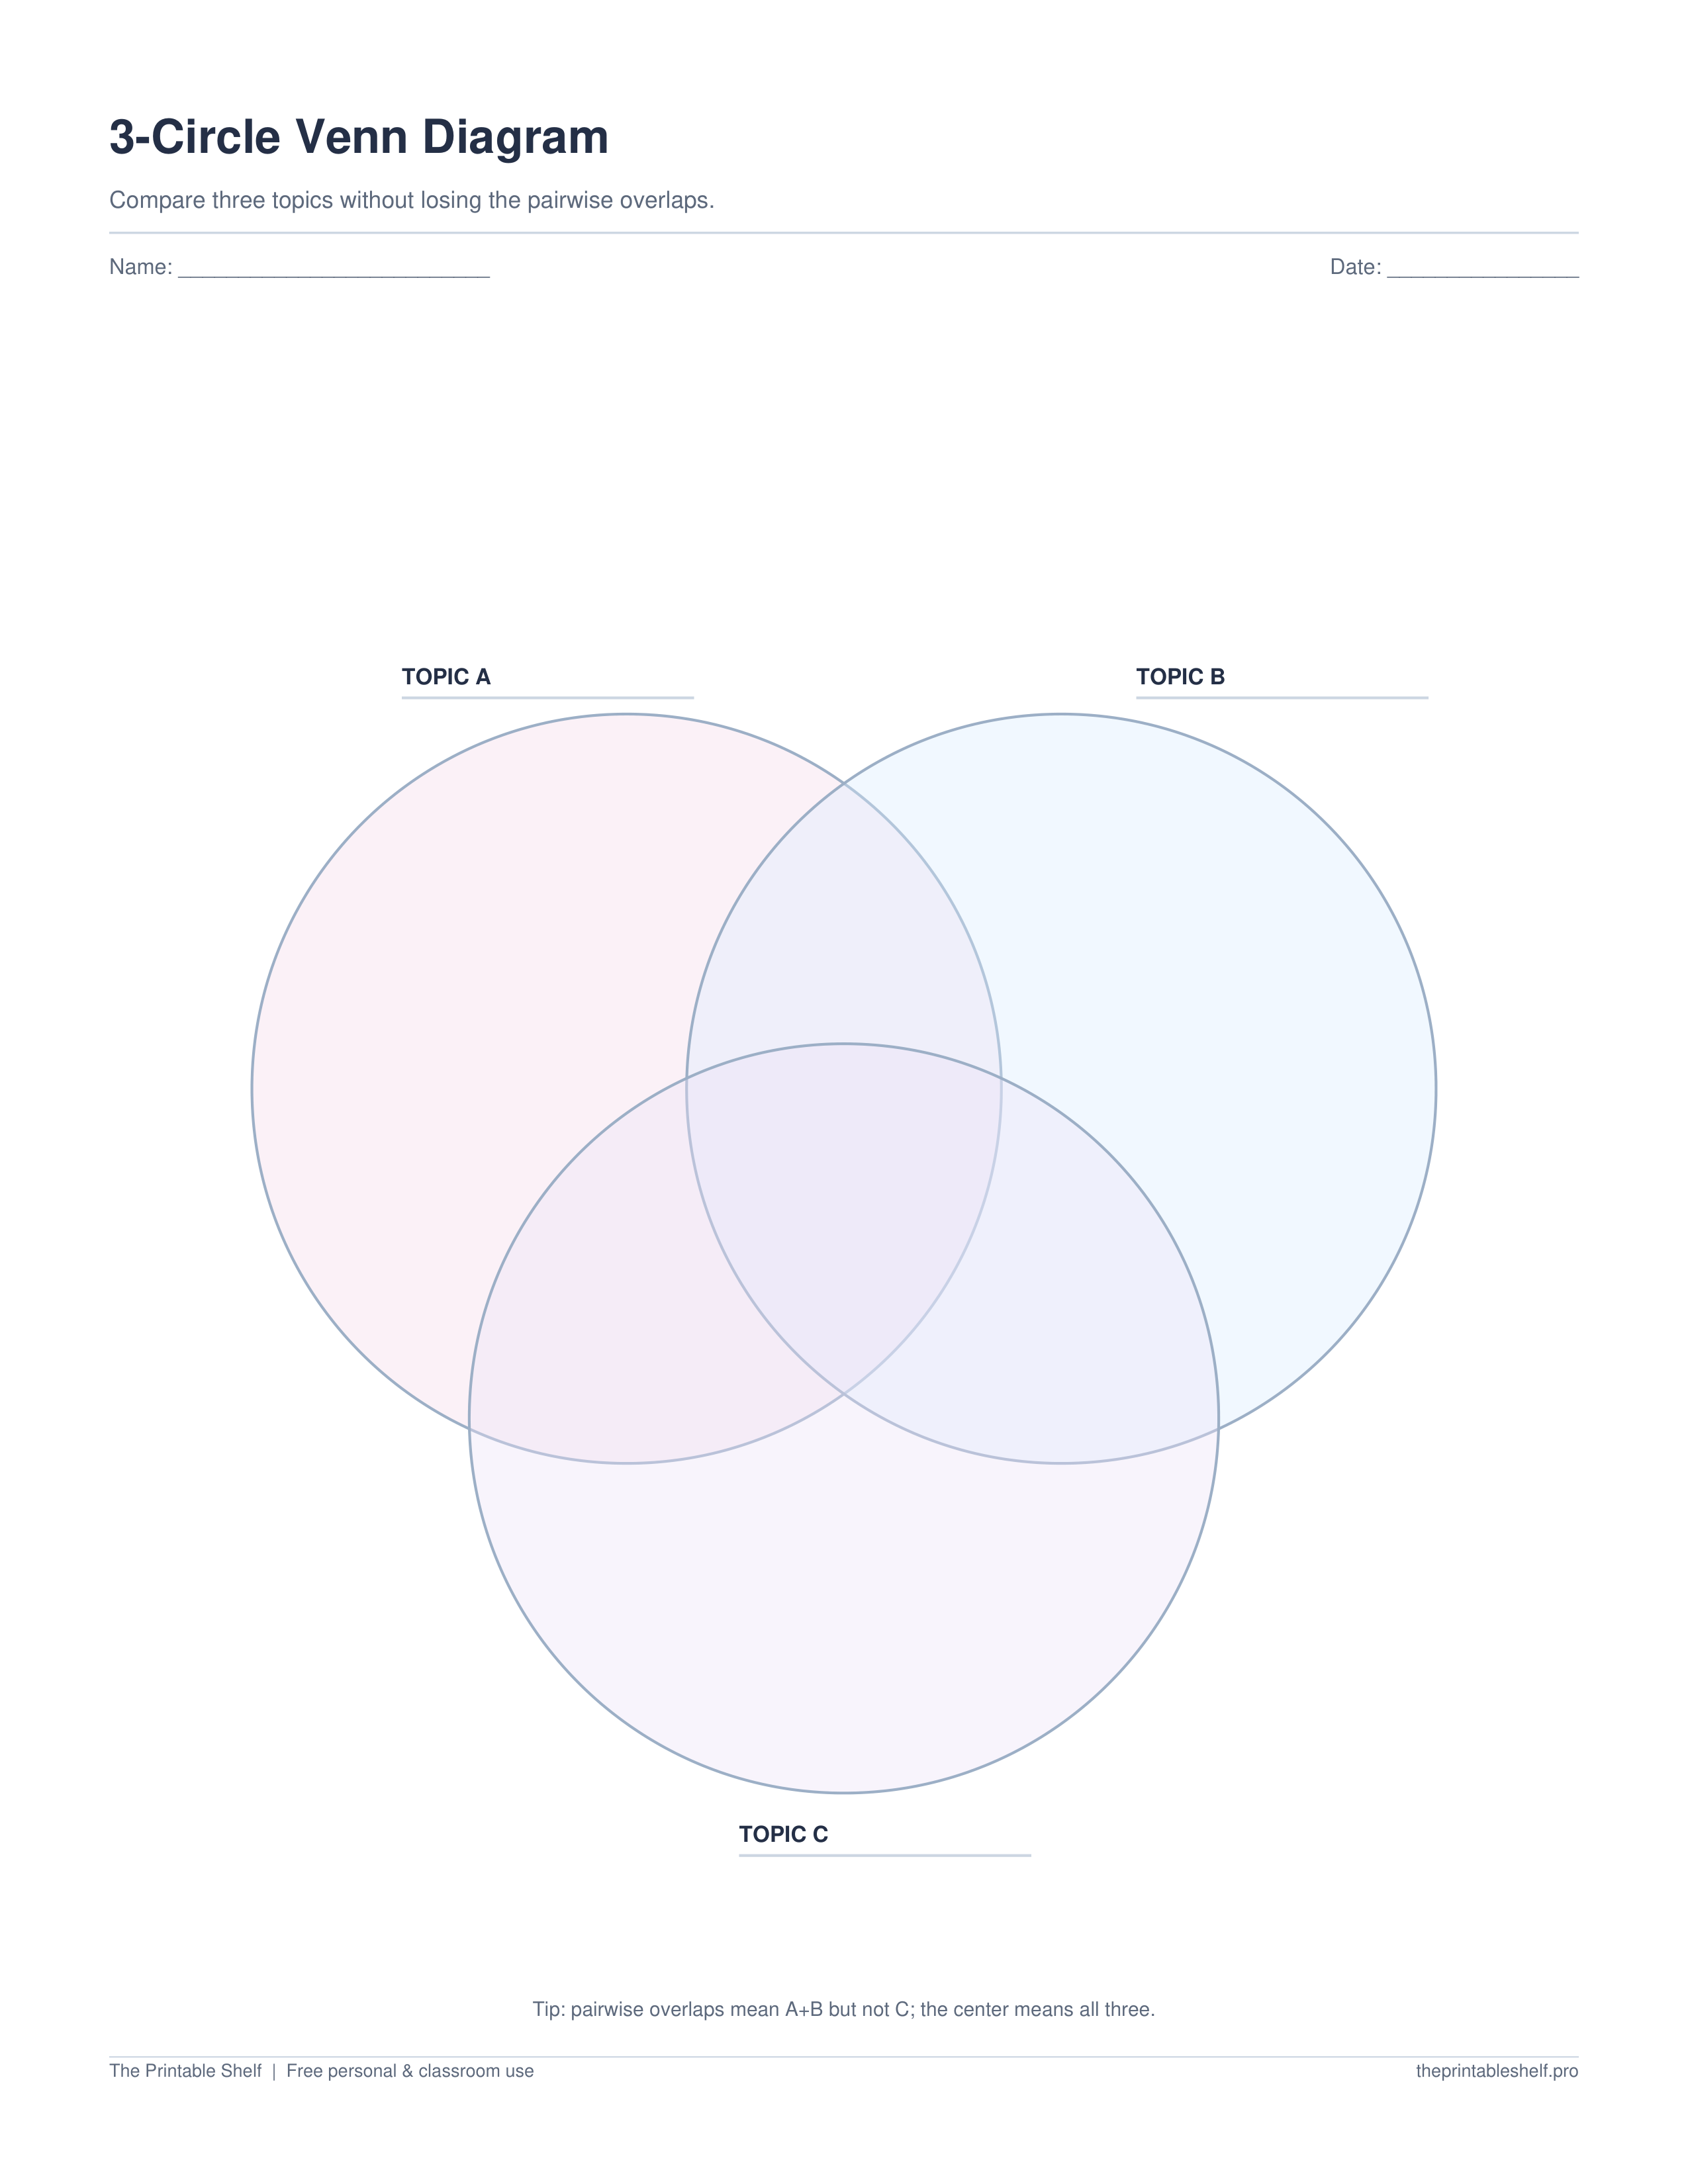
A 3-circle Venn diagram compares three topics at once, showing traits unique to each topic, traits shared by each pair, and traits shared by all three in the center. This printable is best for short phrases and category-level comparisons where the overlaps themselves matter, such as comparing three texts, organisms, systems, or options.
Edited by Tessa Vaughn · Planning & Organization Editor
Free download
Choose your file size
Print at 100% / Actual Size for the cleanest margins. Pick the paper size your printer normally uses.
No sign-up required · personal/classroom use
More useful layouts
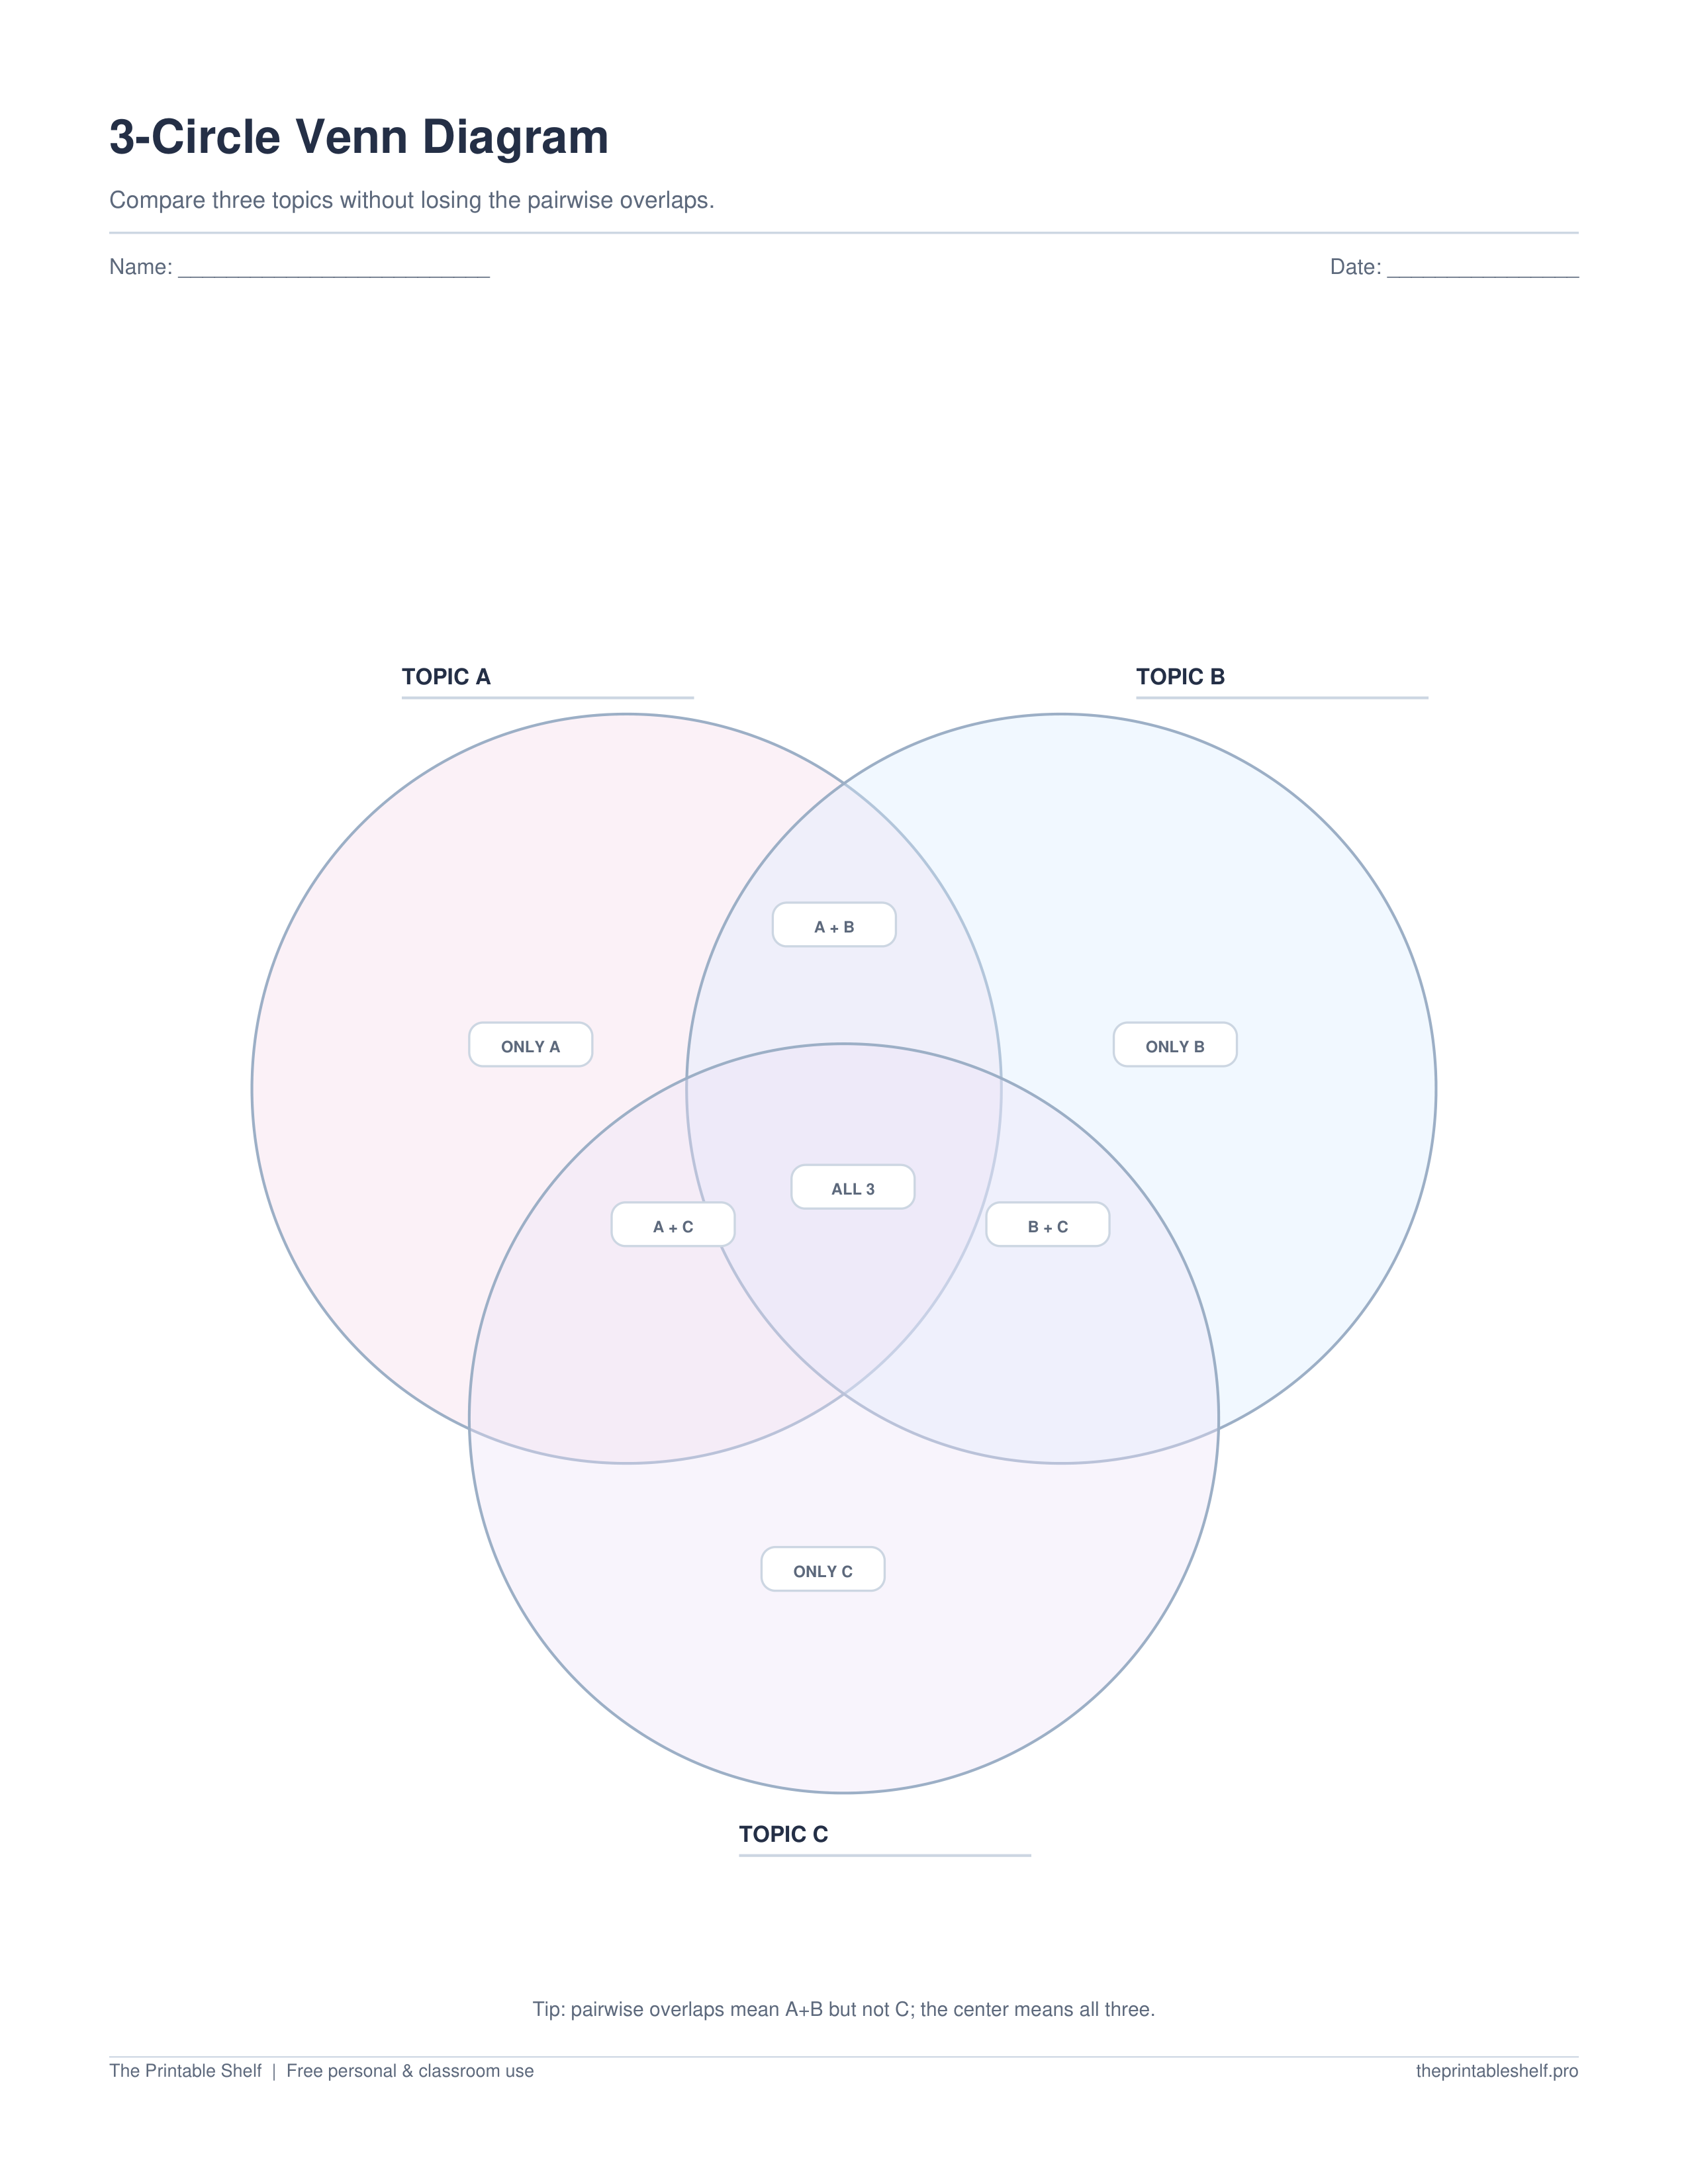
Guided regions
Adds small prompts for only-one, pairwise, and all-three regions so the seven overlap areas are easier to place correctly.
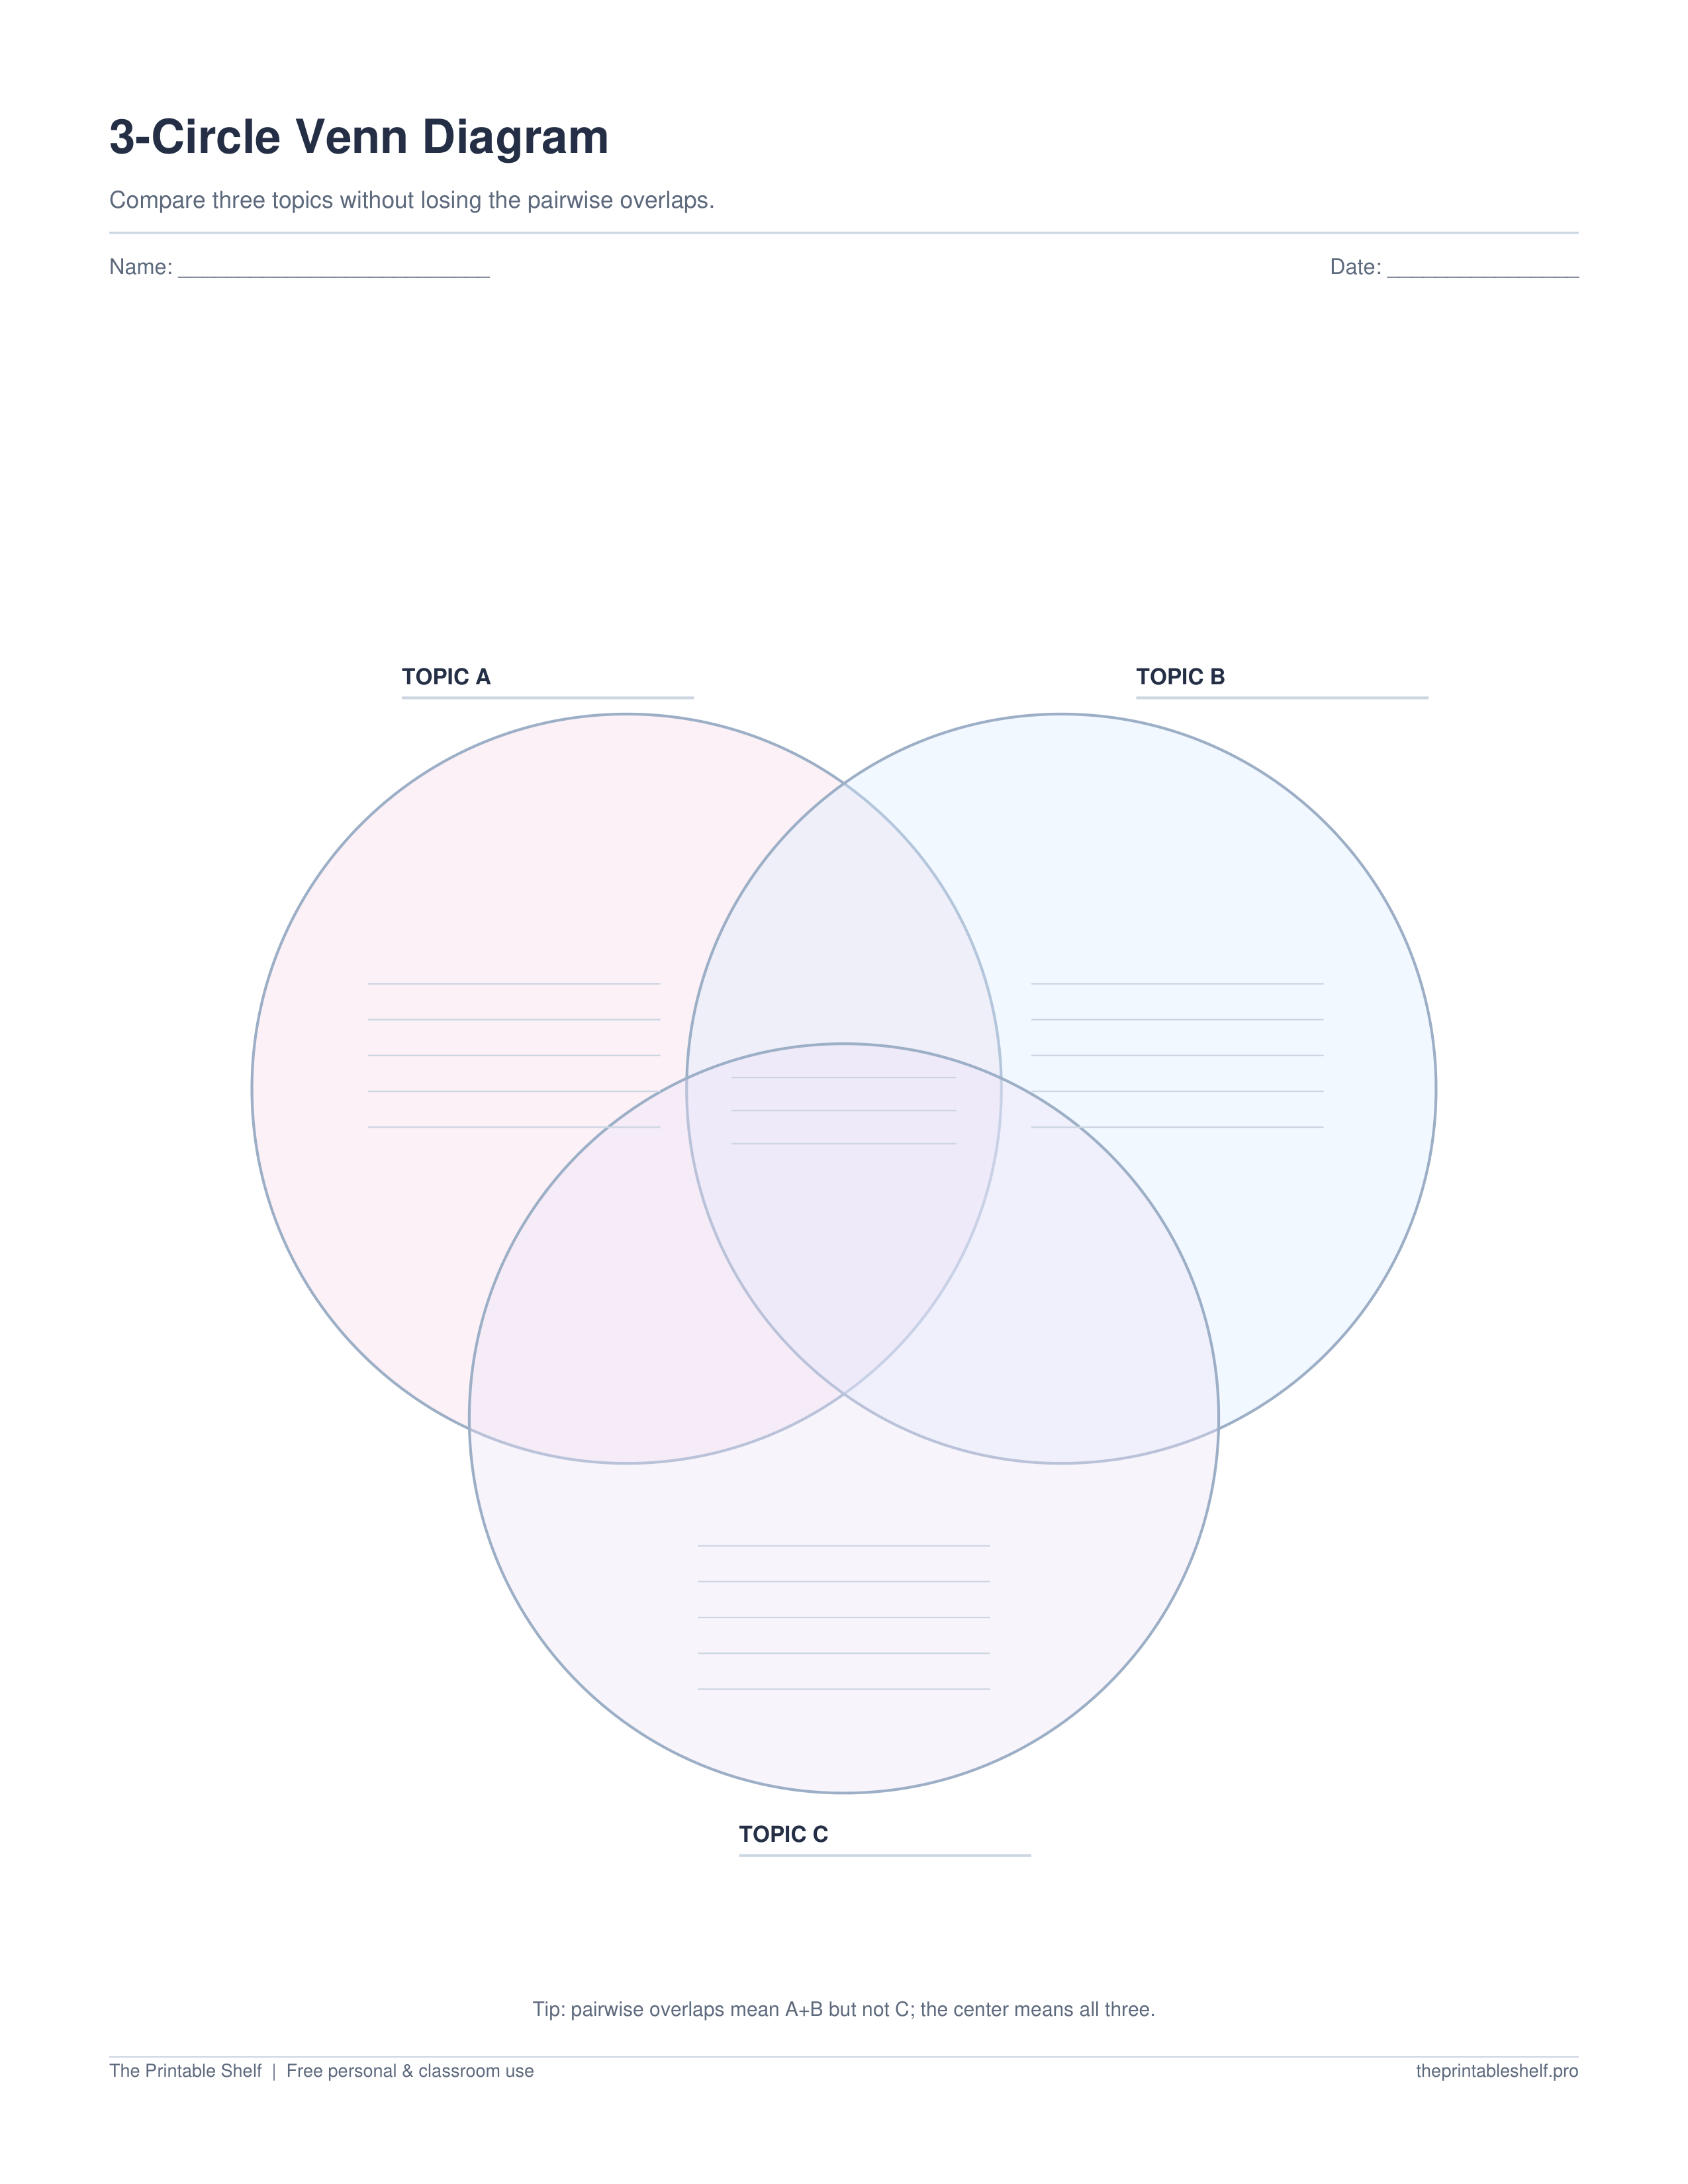
Lined 3-circle Venn
Adds light writing guides in the larger regions for neater short notes while keeping the overlaps visible.
What this printable is for
A three-set comparison organizer with seven meaningful regions: three outer-only areas, three pairwise overlaps, and one center shared by all three topics. It is more demanding than a standard two-circle Venn, so the layout is intended for concise notes and relationships rather than paragraph-length writing. The page also leaves room to label all three topics clearly before the comparison begins.
How to use it
Write one topic beside each circle before adding evidence. Choose three things that can be compared using the same criteria: three characters, three habitats, three historical events, three products, or three solution strategies. Avoid mixing levels such as one broad category, one example, and one feature. A three-circle Venn becomes confusing very quickly when the topics are not parallel enough to support the same questions.
Start with the three outer-only regions. Add details that are true of just one topic and not the other two. Keep each entry short enough to scan, but make it specific: “uses photosynthesis” is useful; “different” is not. When a detail seems unique, check the other two topics before placing it. This small verification step prevents a fact from being parked in an outer region when it actually belongs in an overlap.
Next fill the three pairwise overlaps. These areas are for traits shared by exactly two topics, not all three. Read the labels carefully before writing because pairwise sections are the easiest place to make mistakes. A practical method is to say the pair aloud—“A and B, but not C”—then test the statement against the third topic. If C also shares the trait, move the note to the center instead.
Use the center only for characteristics that apply to all three topics. Do not fill it simply because the page looks empty. In many real comparisons, the center may contain only a small number of strong similarities. That is fine. The diagram is showing the structure of the evidence, not rewarding equal amounts of writing in every region. If nearly everything belongs in the center, the three topics may be too similar for this format to reveal much.
After the notes are placed, look for the comparison pattern rather than stopping at classification. Which pair shares the most relevant features for the task? Which topic has meaningful unique features? Is there a trait shared by all three that changes how you understand the differences? Mark the observations that most directly support the discussion answer or comparison paragraph. The diagram becomes much more valuable when it leads to a conclusion instead of remaining a sorting exercise.
For younger learners, model a representative outer-only fact, pairwise overlap, and center fact before independent work. For dense topics or full sentences, switch to a three-column comparison chart because three overlapping circles have limited writing room. The 3-circle Venn is strongest when the relationships between sets are the point and the notes can stay compact.
Customize instead
Need a different title, paper size, or orientation? →
Use the free Graphic Organizer Maker to build a custom Venn, KWL, Frayer, story map, T-chart, main-idea, sequence, or cause-and-effect page.
Best uses for this template
Ways to use it
Three texts or characters
Track unique traits, similarities shared by two texts, and ideas or features that all three have in common before writing a comparison.
Science classification
Compare three organisms, materials, systems, or processes while keeping pairwise relationships visible instead of flattening everything into a list.
Option analysis
Use three circles for choices that share features in different combinations, then mark which overlaps matter most to the final decision.
Common mistakes to avoid
Putting every similarity in the center
Test whether the third topic also shares the trait. If not, use the correct two-circle overlap.
Choosing three topics at different levels
Compare three parallel subjects that can answer the same criteria or questions.
Trying to write paragraphs inside the circles
Use compact phrases and move to a table or box organizer when explanations need more space.
Included layout options
Blank 3-circle
Fast open-ended comparison
Layout: Large unlabeled circles with topic label lines
Guided regions
Reduce confusion about pairwise versus all-three overlaps
Layout: Small region prompts for Only A, A+B, All 3, and matching sections
Lined
Support neater short written responses
Layout: Light writing guides in outer and major overlap areas
Classroom fit
Suggested grades, use modes & standards
Suggested grade bands
These are practical use ranges, not hard limits. Text complexity and the amount of teacher modeling matter more than the worksheet alone.
Good fit for
Scaffold level: Advanced.
Common Core crosswalk
No narrow standards code is listed for this general-purpose template. Use it where the thinking task fits your local curriculum.
Frequently asked questions
What goes in the center of a 3-circle Venn diagram?
Put only traits or facts that are true of all three topics in the center where all three circles overlap.
What goes in the areas where only two circles overlap?
Those pairwise regions hold details shared by exactly those two topics but not by the third topic.
When should I use a 3-circle Venn instead of a table?
Use the Venn when overlapping relationships are important and notes can stay short. Use a table when you need longer explanations or many fixed comparison criteria.
Helpful guides
See where this organizer fits, when a different layout works better, and how to turn the completed page into a useful next step.
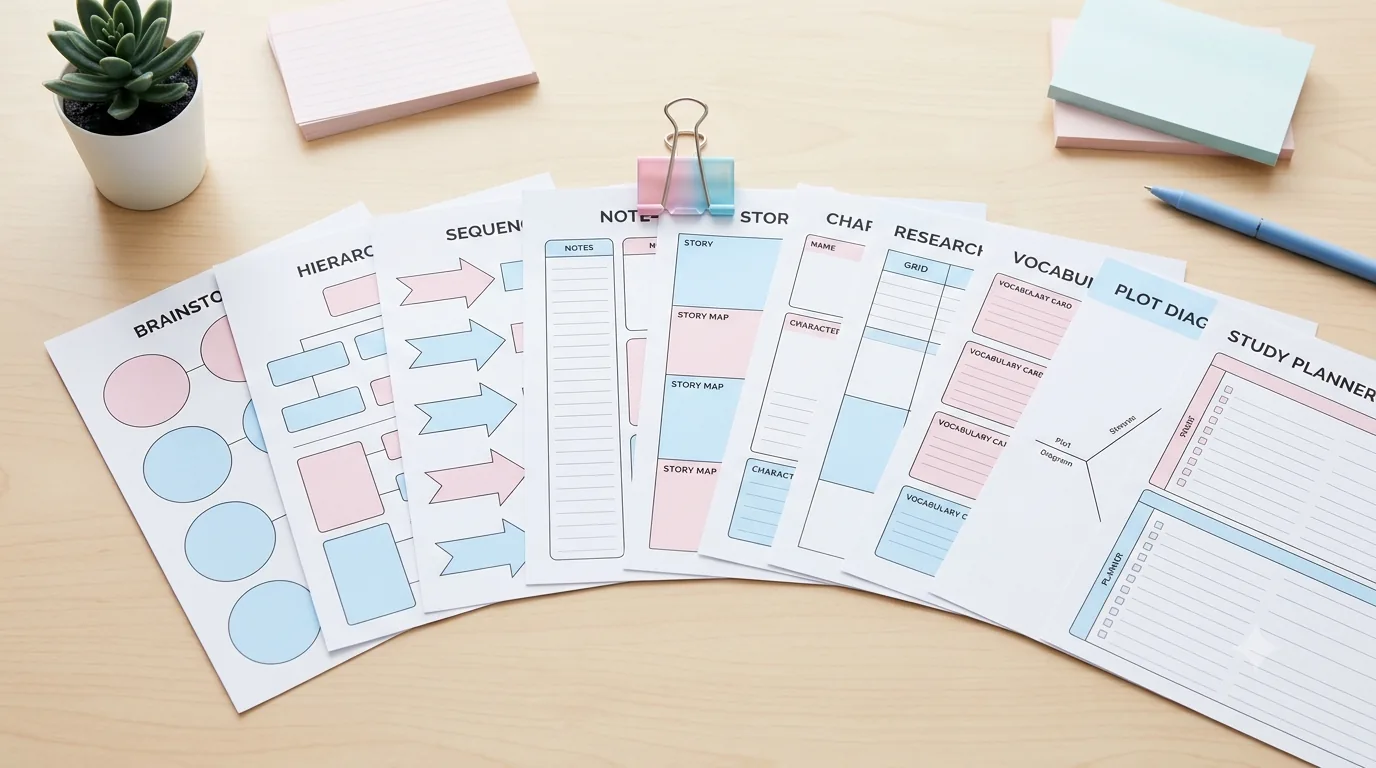
10 Free Graphic Organizers for Reading, Writing, and Studying
Download 10 free graphic organizers for reading, writing, comparison, vocabulary, sequencing, and study. Includes a guide to choosing the right one.
Read guide →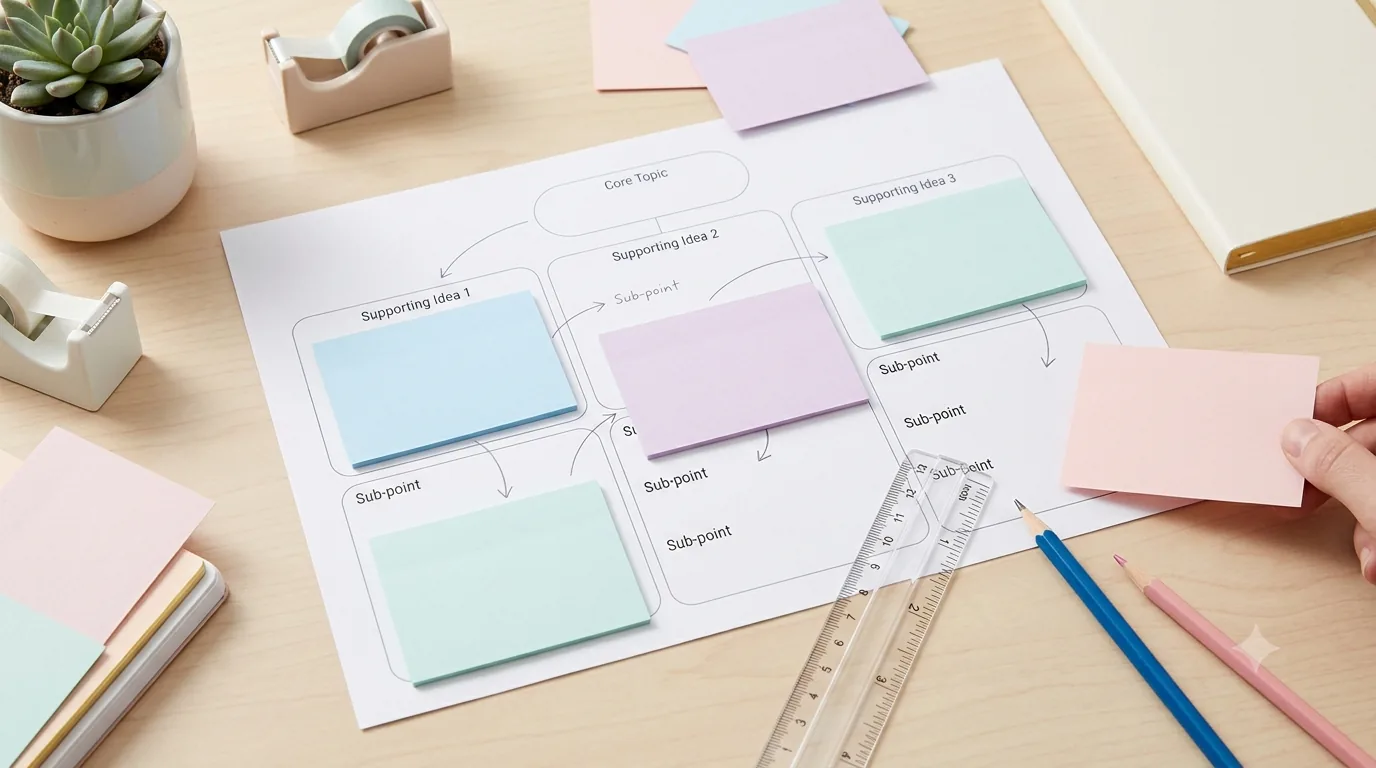
How to Use Graphic Organizers Effectively (Without Turning Them Into Busywork)
Learn how to choose, model, scaffold, and reuse graphic organizers so students think with them instead of simply filling in boxes.
Read guide →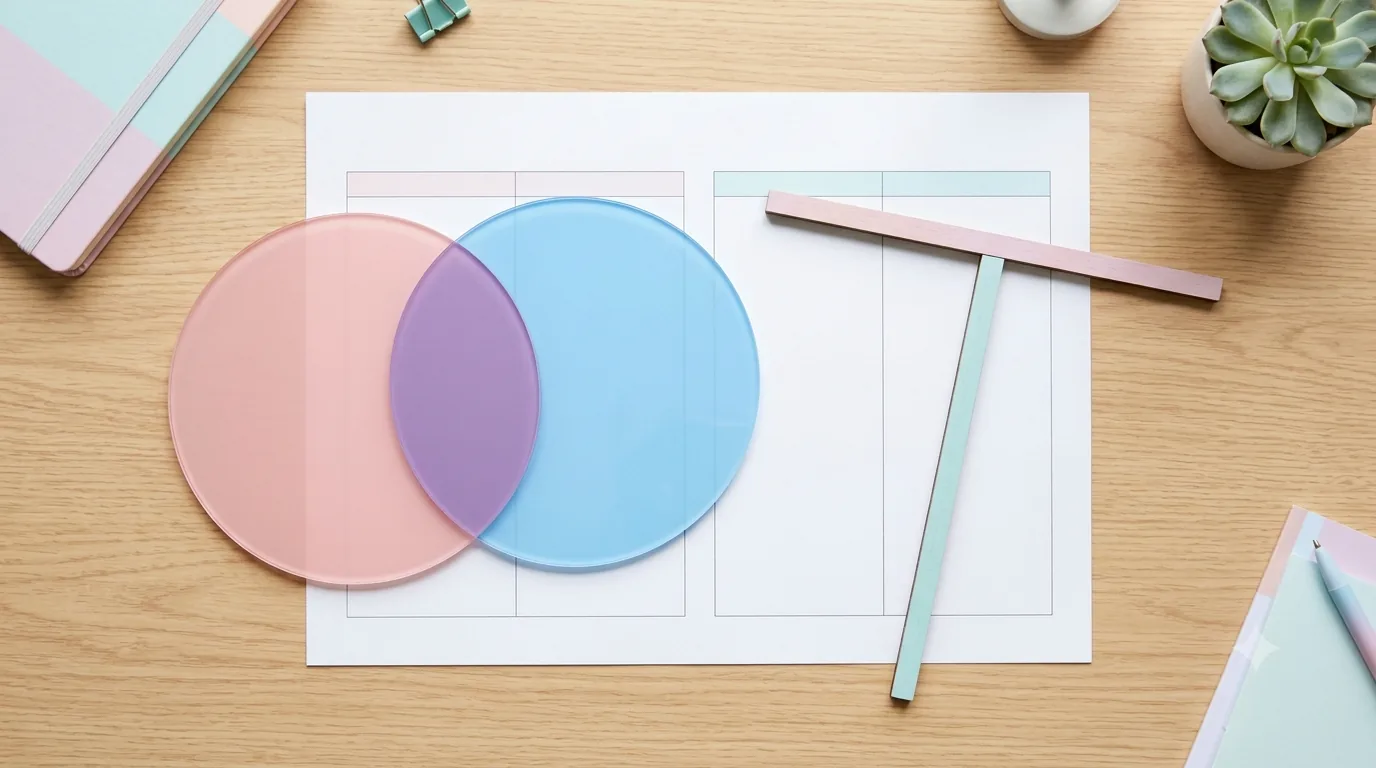
Venn Diagram vs. T-Chart: Which One Should You Use?
Compare Venn diagrams and T-charts, see when each organizer works best, and use a simple decision rule for reading, writing, and classroom tasks.
Read guide →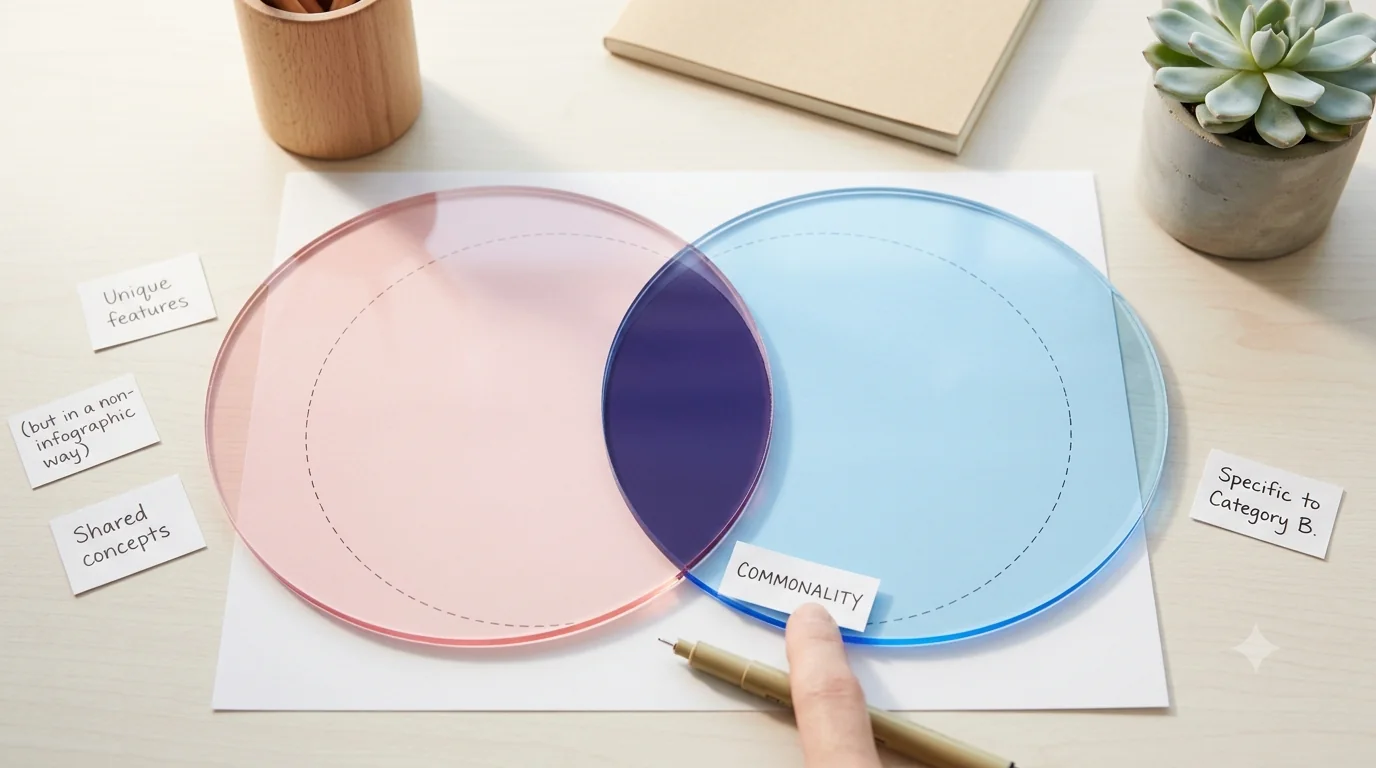
7 Venn Diagram Mistakes That Make Compare-and-Contrast Work Weaker
Fix seven common Venn diagram mistakes, from mismatched criteria to vague overlap, and turn the organizer into stronger compare-and-contrast thinking.
Read guide →Keep organizing
You might also like
Free printable
Printable Venn Diagram Template
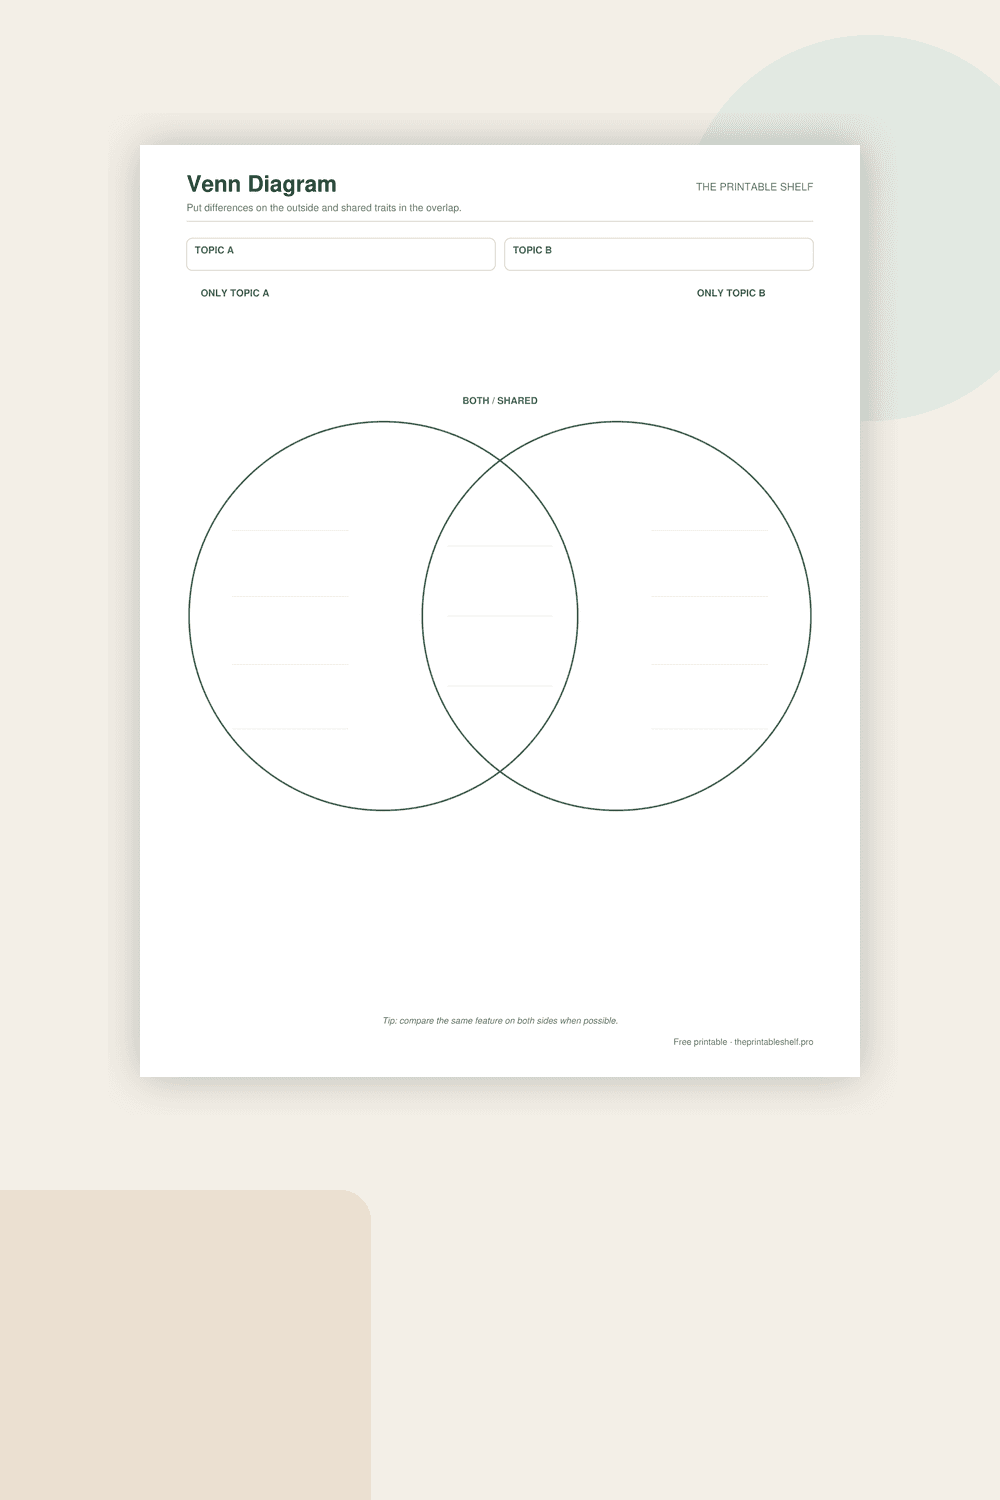
A clean two-circle comparison organizer with dedicated topic fields, generous writing space, and light writing guides. The page is intentionally simple so the visual relationship does the teaching: differences stay on the outside, while anything true of both topics belongs in the middle overlap.
Free printable
Compare and Contrast Graphic Organizer
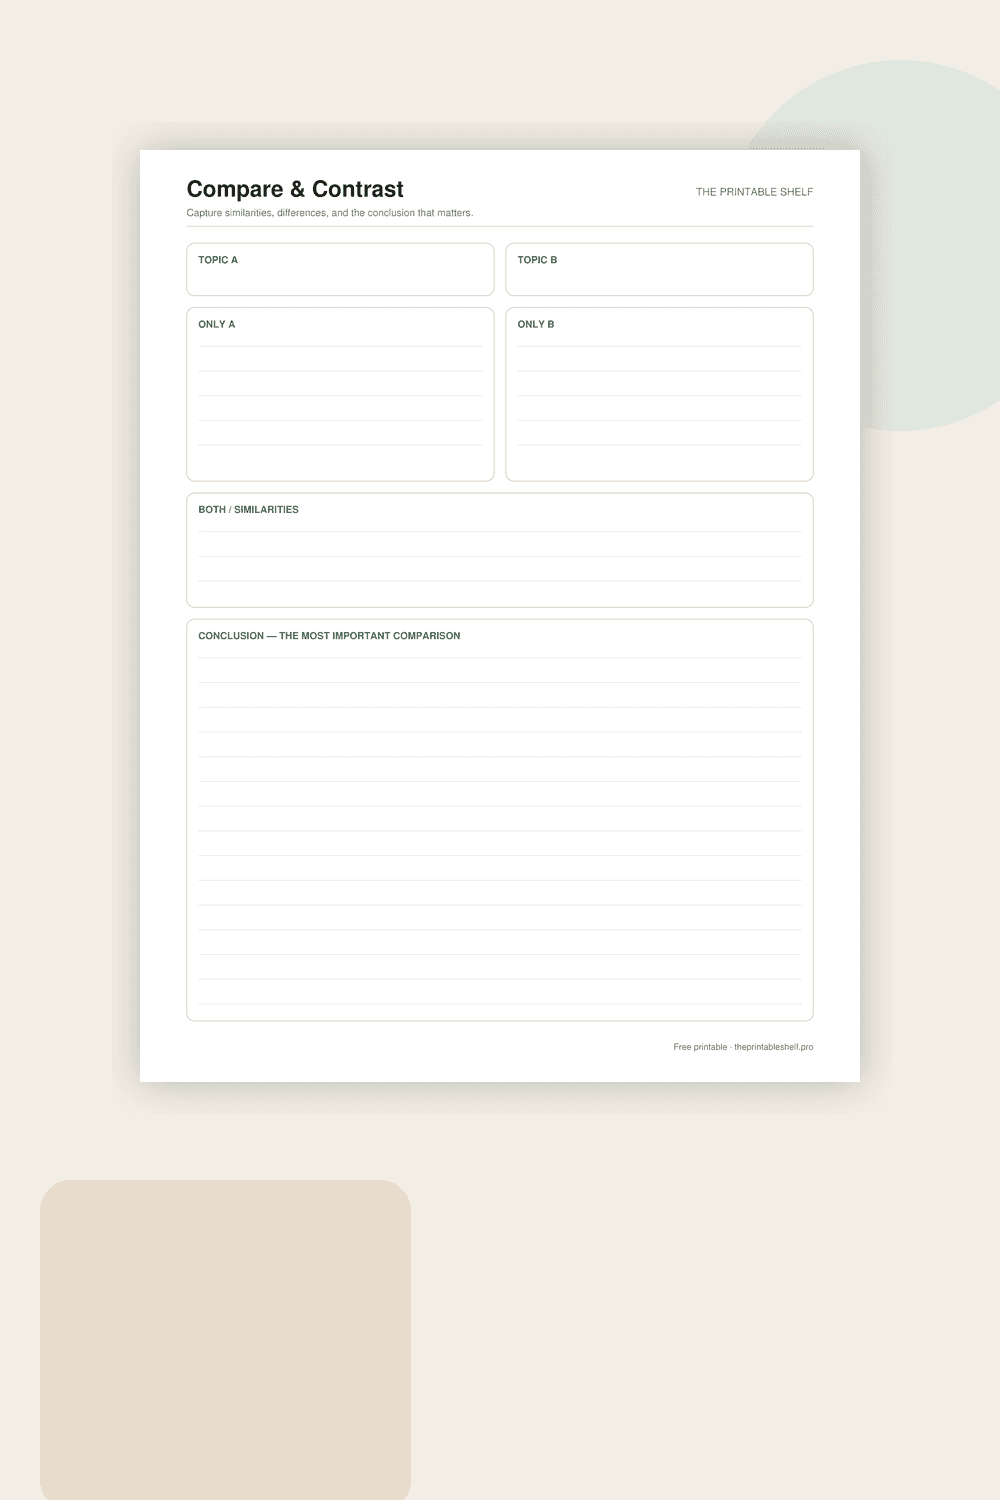
A structured alternative to a Venn diagram for learners who need more writing space. Two difference boxes sit side by side, a full-width similarities area keeps shared traits together, and the final conclusion section turns the collected notes into an actual comparison rather than stopping at a list.
Free printable
Printable T-Chart Graphic Organizer
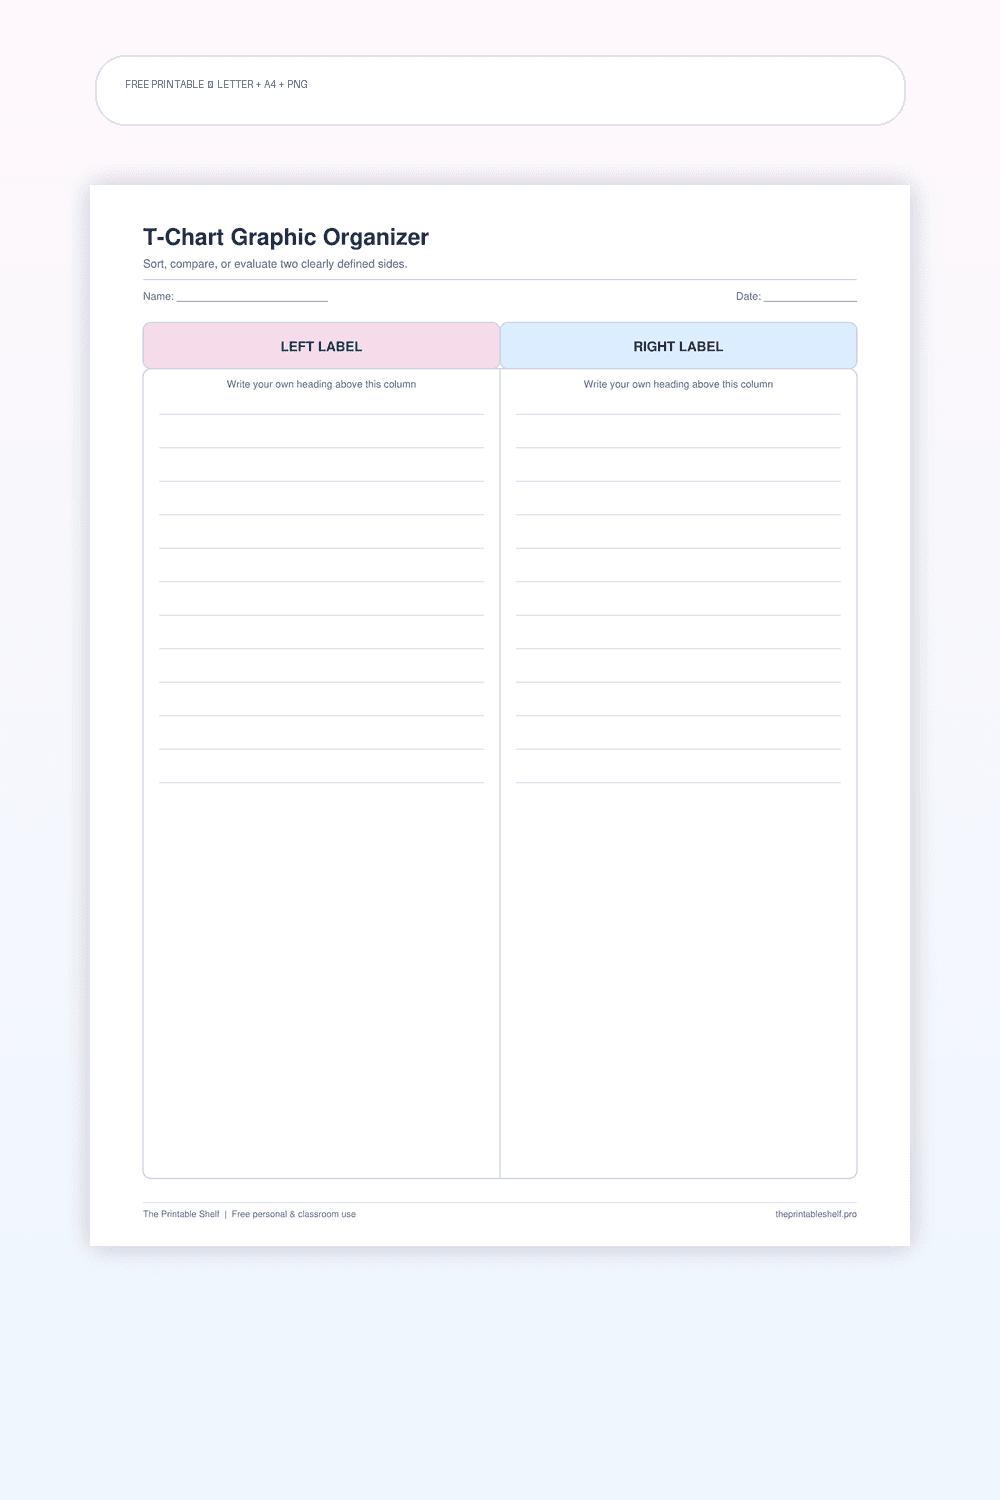
A clean two-column thinking sheet that can be relabeled for dozens of school, study, and planning tasks. Unlike a compare-and-contrast organizer with fixed prompts, a T-chart stays intentionally open: the user decides what the two sides mean, which makes it useful for classification, decision-making, text evidence, observation, and quick note sorting.